Using Fuzzy Grouping in SQL Server Integration Services for removing duplicates, fixing spelling errors, and converting abbreviations to full job titles
I had a dataset with this list of occupations:
CUST SERVICE REP.
CUSTOMER SERVICE REPRESENTATIVE
SHIFT LEAD
REGION MANAGER
ASSISTANT
REGIONAL MANAGER
STORE MGR.
CUSTOMER SERVICE REP
CUSTOMER SERVICE REPRESENTATIVE
STORE MANAGER
DISTRICT MANAGER
ASSIST. MANAGER
CUTSOMER SERIVCE REPRESENTATIVE
SHIFT LEADER
REGIONAL MANAGER
STORE MANAGER
DISTRICT MGR.
REGIONAL MGR
SHIFT LEADER
CUSTOMER SERIVCE REP
ASSISTANT MANAGER
DISTRICT MANAGER
In the notation a -> b meaning a should be replaced with b, with the data I received, I wanted the system to do the following for me. I also wanted to return the list of distinct values after applying the replacement aforementioned:
CUST SERVICE REP.               -> CUSTOMER SERVICE REPRESENTATIVE
CUSTOMER SERVICE REPRESENTATIVE -> CUSTOMER SERVICE REPRESENTATIVE
SHIFT LEAD                      -> SHIFT LEADER
REGION MANAGER                  -> REGIONAL MANAGER
ASSISTANT                       -> ASSISTANT MANAGER
REGIONAL MANAGER                -> REGIONAL MANAGER
STORE MGR.                      -> STORE MANAGER
CUSTOMER SERVICE REP            -> CUSTOMER SERVICE REPRESENTATIVE
CUSTOMER SERVICE REPRESENTATIVE -> CUSTOMER SERVICE REPRESENTATIVE
STORE MANAGER                   -> REGIONAL MANAGER
DISTRICT MANAGER                -> DISTRICT MANAGER
ASSIST. MANAGER                 -> ASSISTANT MANAGER
CUTSOMER SERIVCE REPRESENTATIVE -> CUSTOMER SERVICE REPRESENTATIVE
SHIFT LEADER                    -> SHIFT LEADER
REGIONAL MANAGER                -> REGIONAL MANAGER
STORE MANAGER                   -> STORE MANAGER
DISTRICT MGR.                   -> DISTRICT MANAGER
REGIONAL MGR                    -> REGIONAL MANAGER
SHIFT LEADER                    -> SHIFT LEADER
CUSTOMER SERIVCE REP            -> CUSTOMER SERVICE REPRESENTATIVE
ASSISTANT MANAGER               -> ASSISTANT MANAGER
DISTRICT MANAGER                -> DISTRICT MANAGER
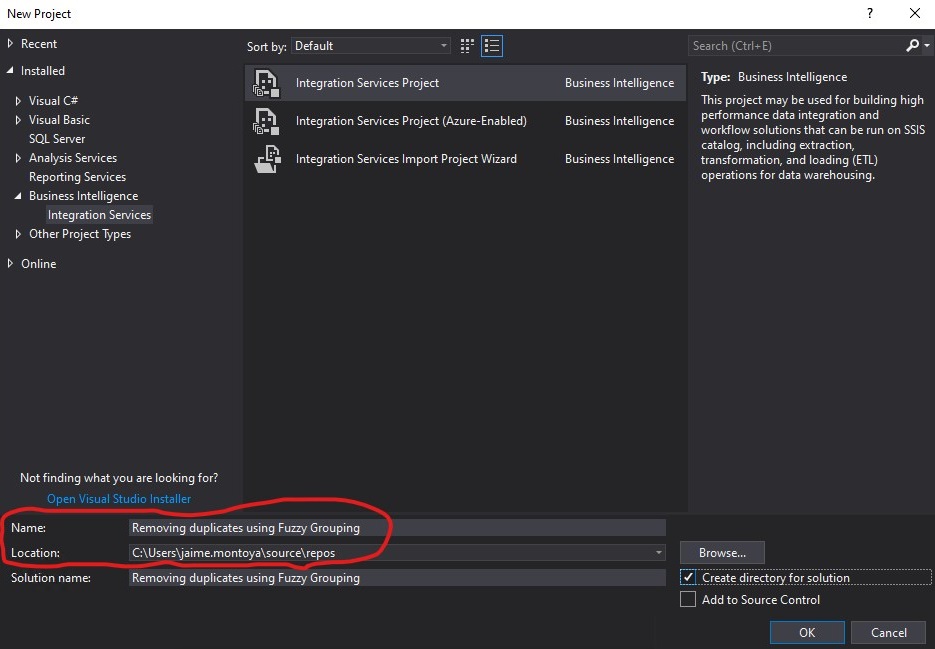
My dataset was FuzzyGroupingExample.txt. I started by created my my reference table from that database. I opened Visual Studio and created a new project:
I provided a name and location for my new project:
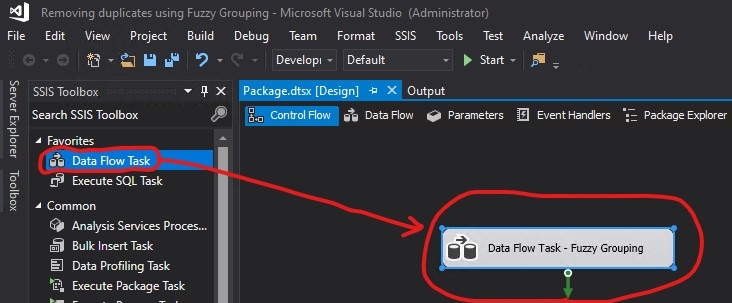
I created a Data Flow Task:
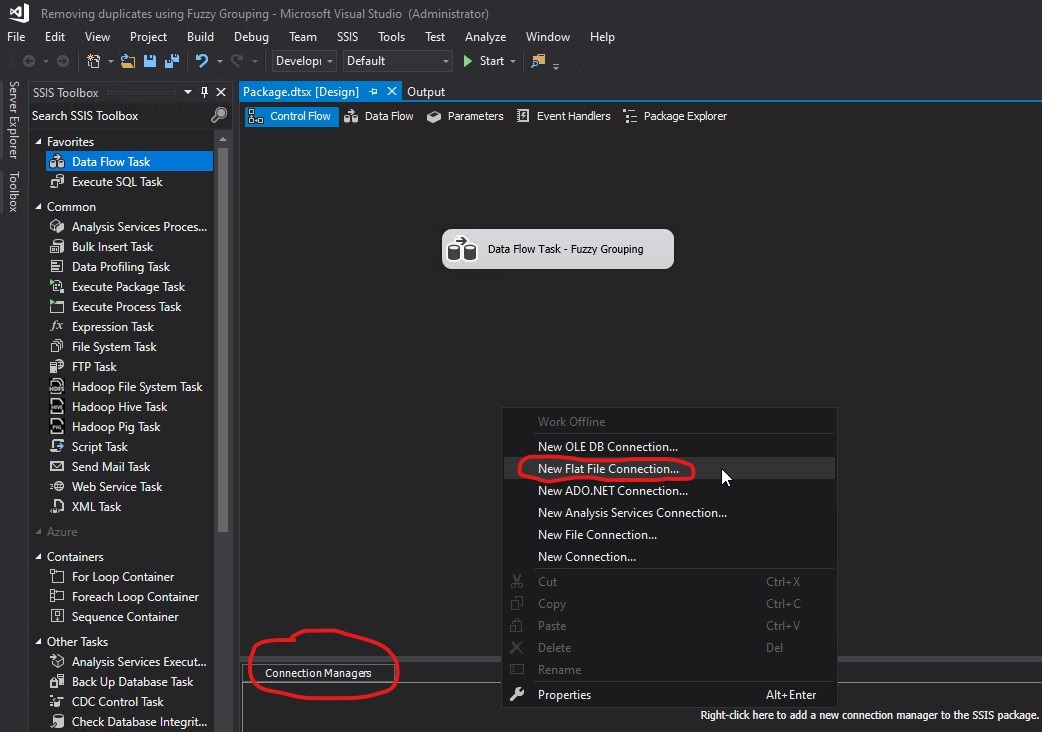
I right-clicked the Connection Managers area and then clicked New Flat File Connection...
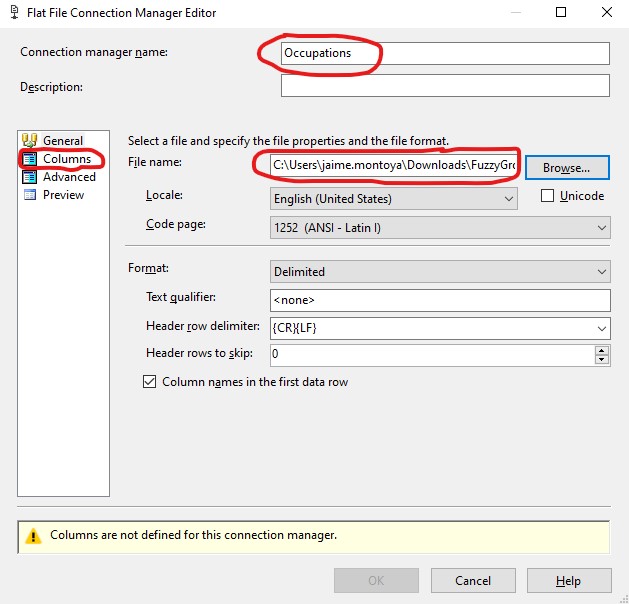
I provided a name and chose the file to use (FuzzyGroupingExample.txt). Then I clicked Columns to define the columns to use for this connection manager:
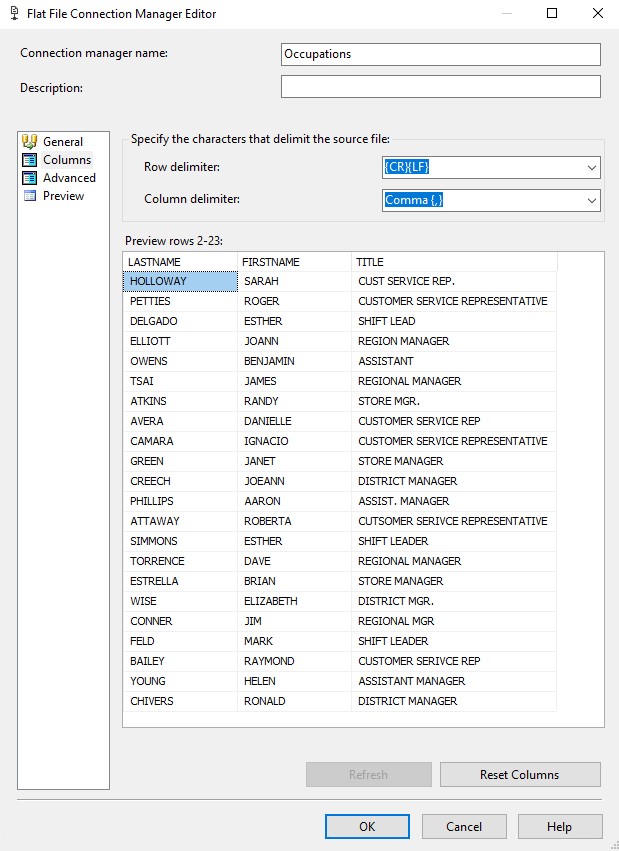
Notice the warning in the image above: Columns are not defined for this connection manager. It disappeared when clicking Columns and going back to General without further actions. From the Columns section, I confirmed that my data was displaying correctly, and clicked OK.
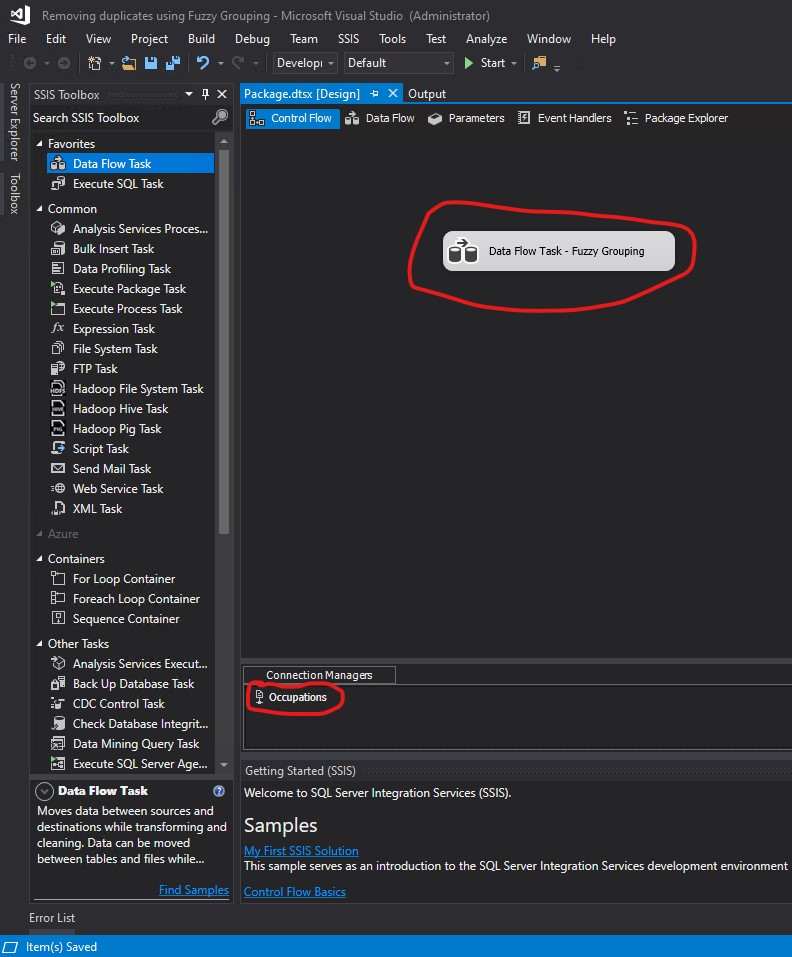
My connection was created successfully. I double clicked my Data Flow Task to open it:
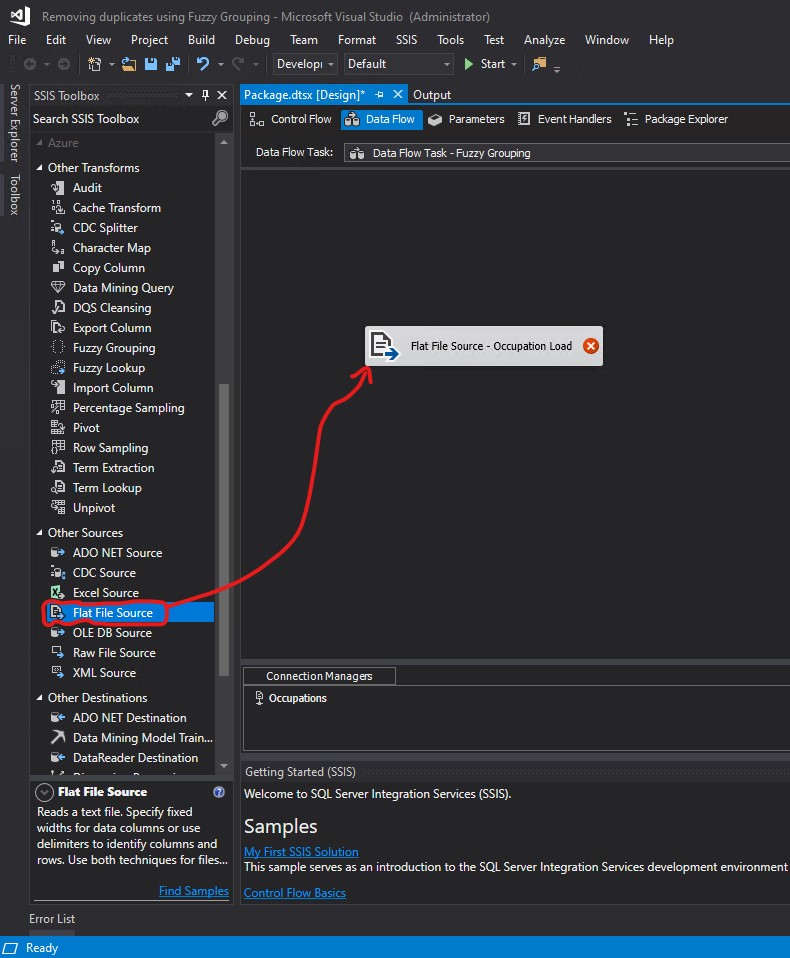
I created a Flat File Source and double clicked to open it.
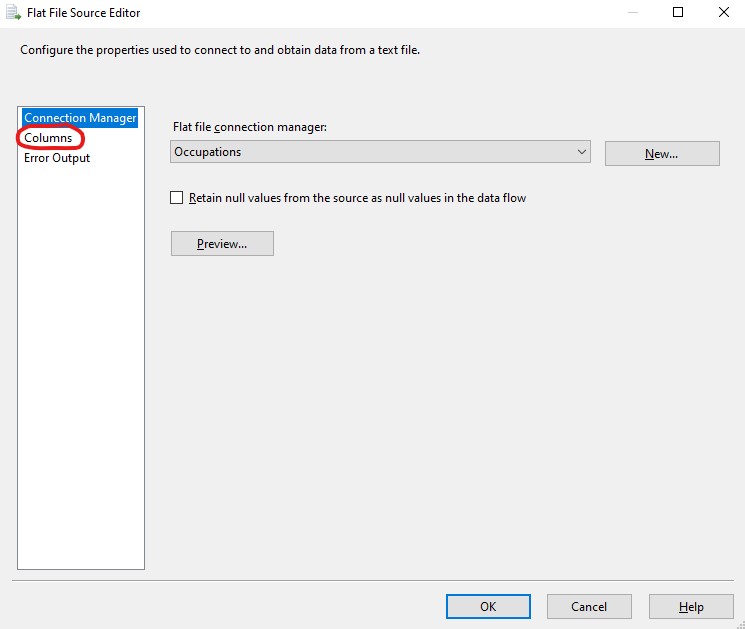
From the Flat File Source Editor, I clicked Columns:
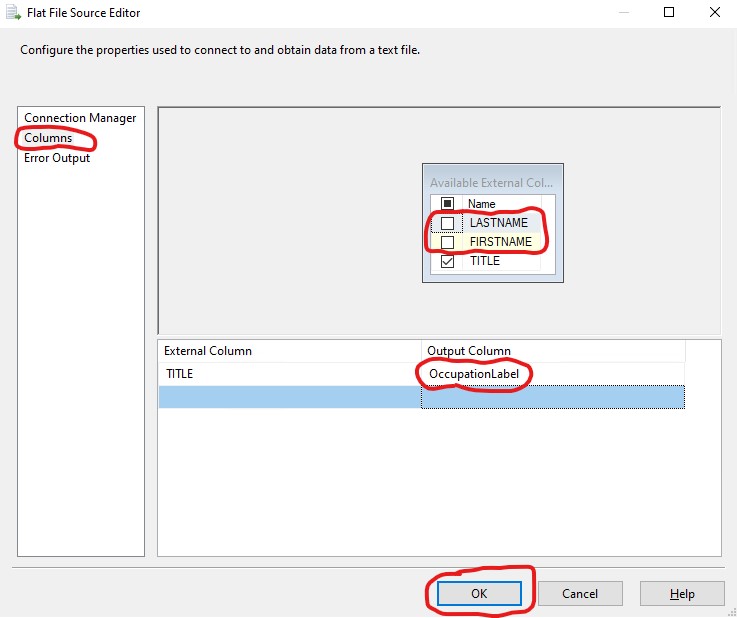
I unchecked LASTNAME and FIRSTNAME because I was creating my reference table, which should not have employee names, but only occupations. I renamed the Output Column to OccupationLabel. Then I clicked OK:
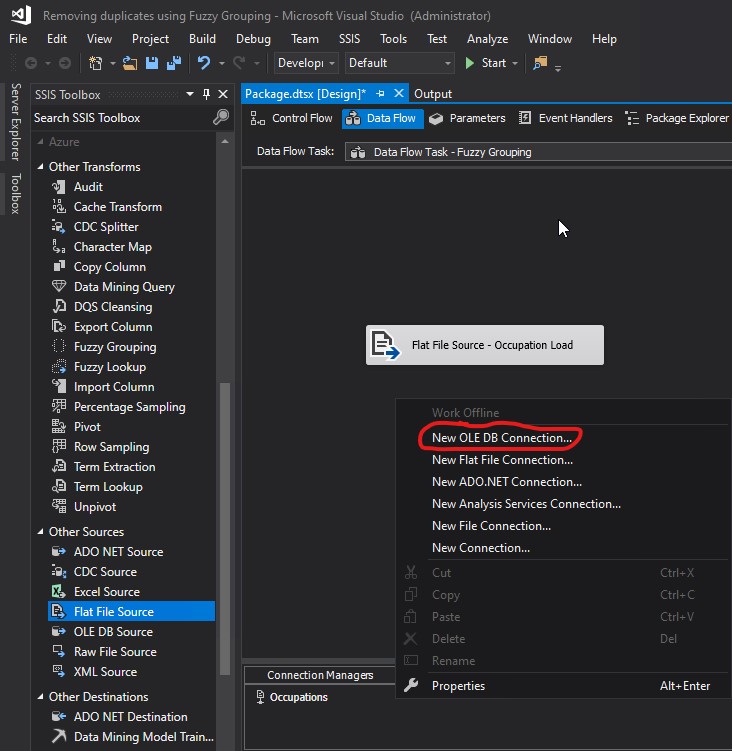
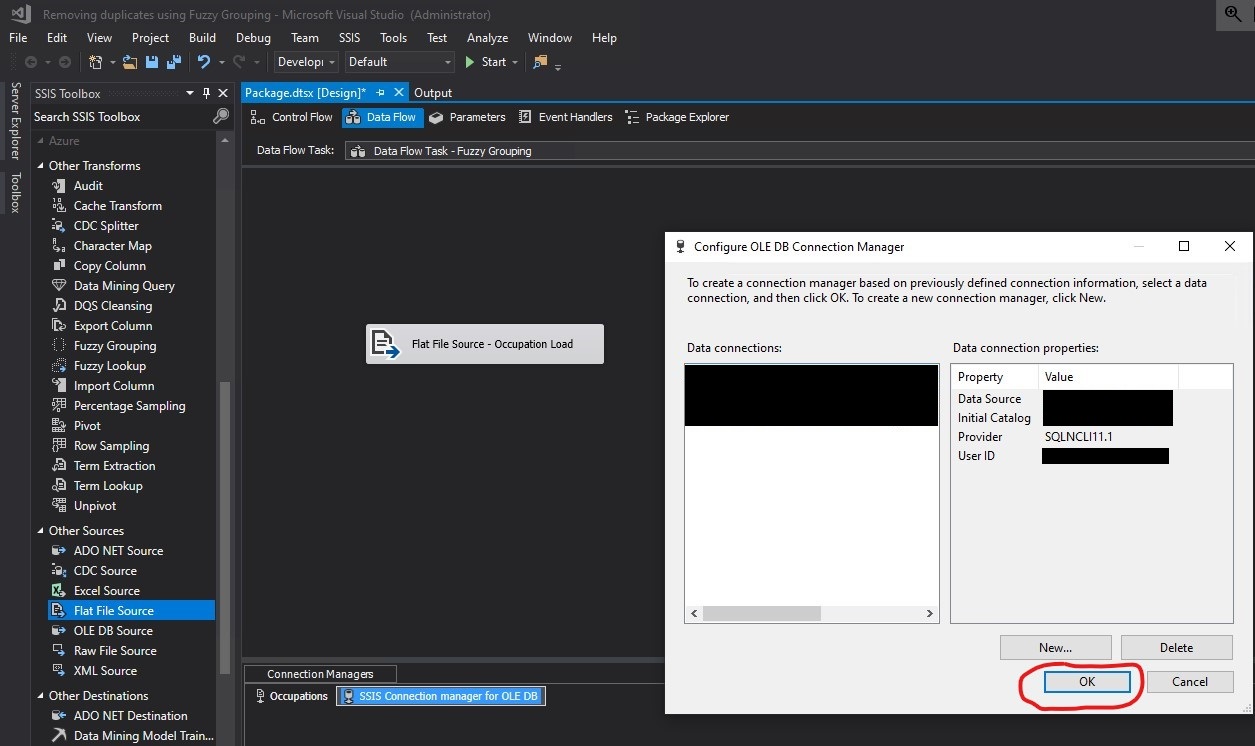
I created another connection, this time a New OLE DB Connection...
I chose the database that I wanted to use and clicked OK:
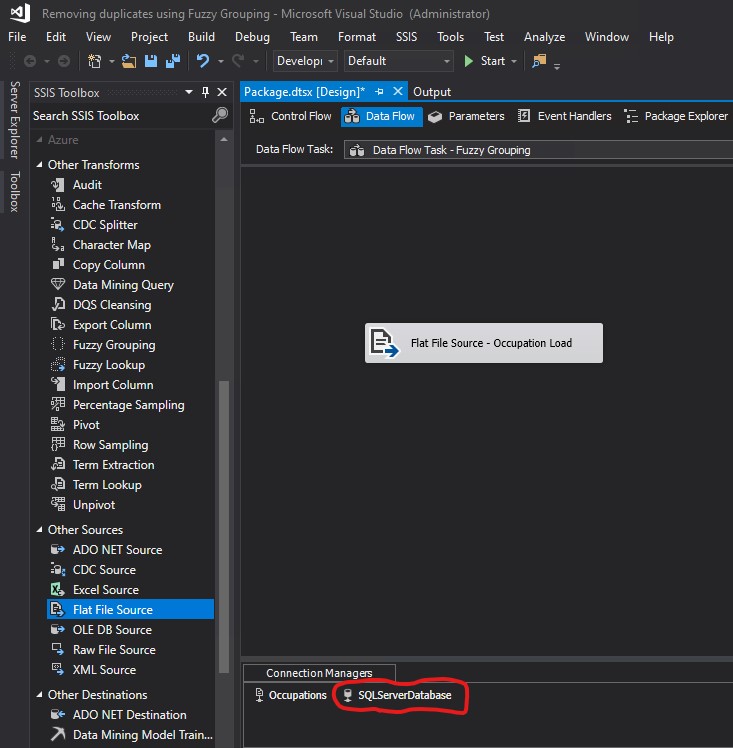
I renamed my connection to SQLServerDatabase:
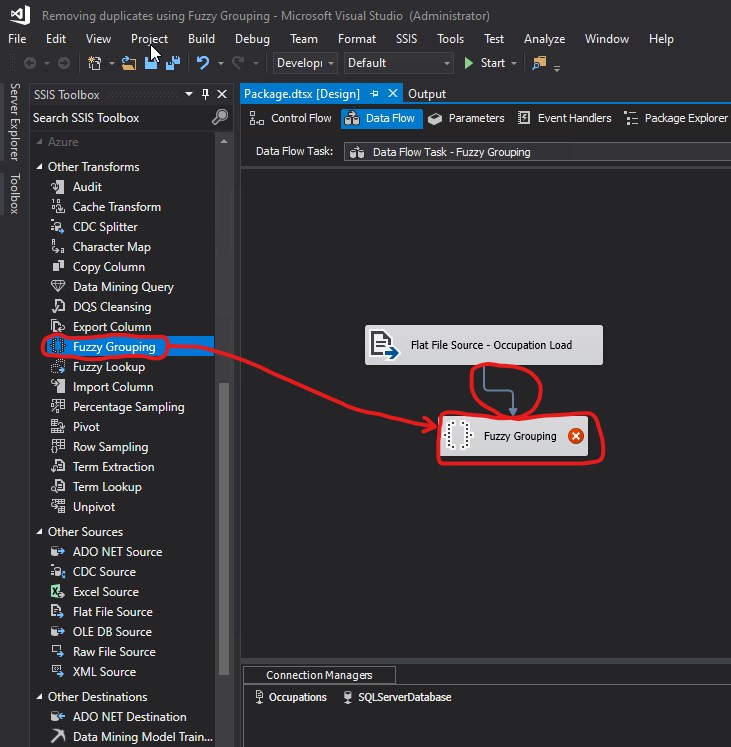
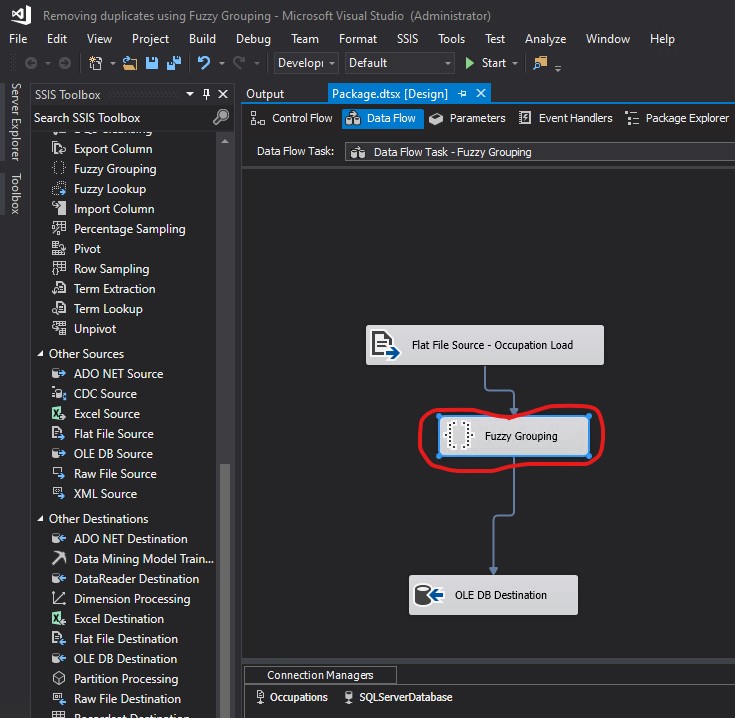
I created a Fuzzy Grouping Transformation and connected the arrow from Flat File Source - Occupation Load to Fuzzy Grouping. Then I double clicked Fuzzy Grouping to open it.
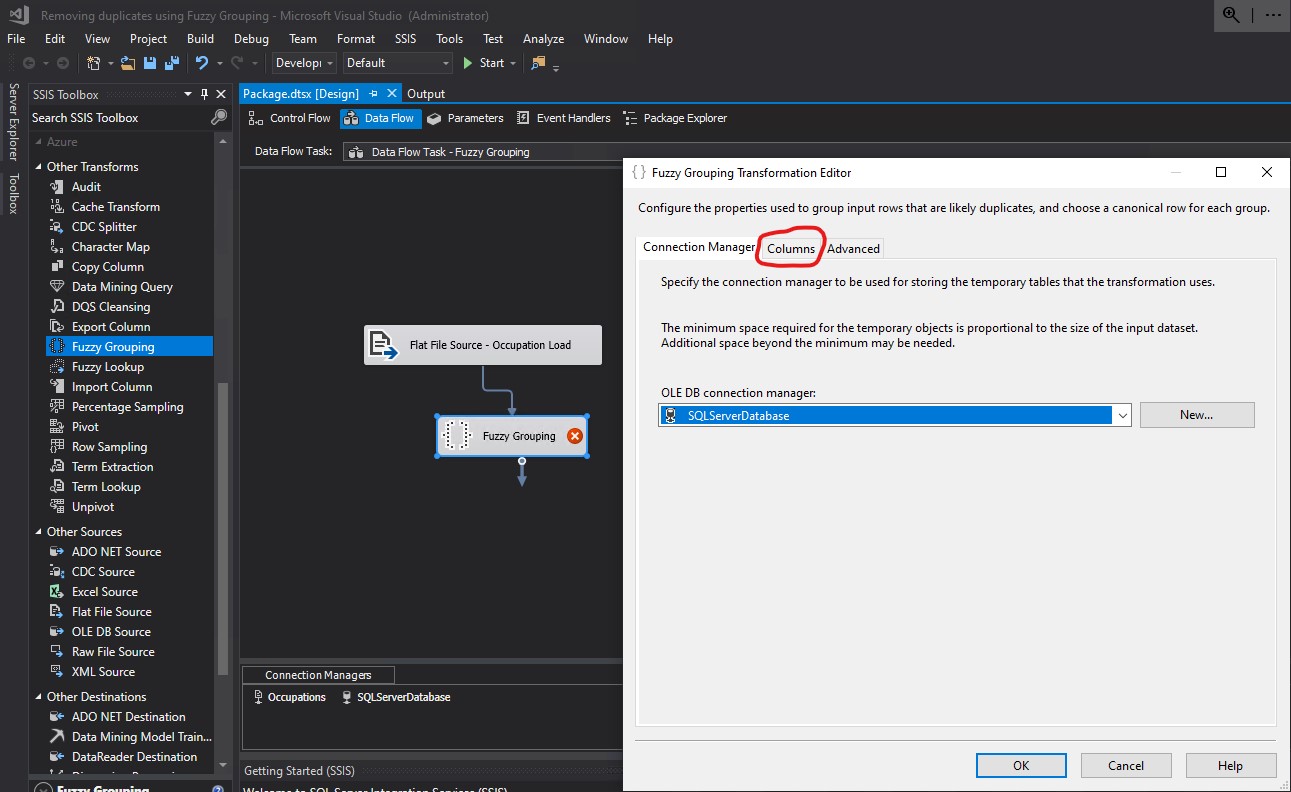
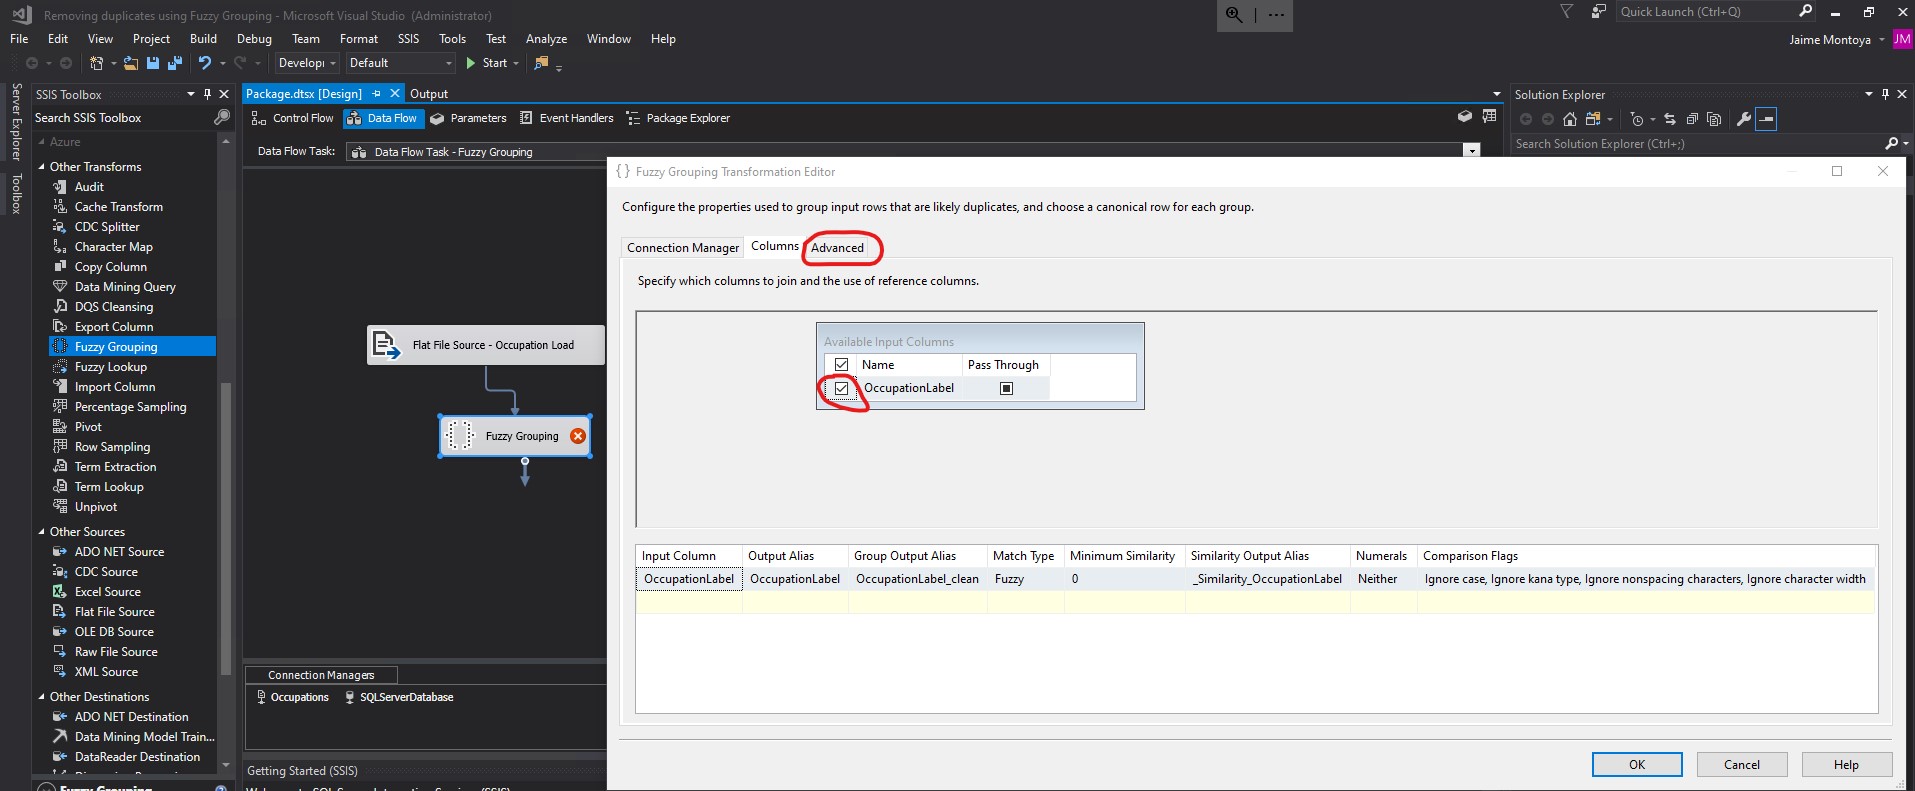
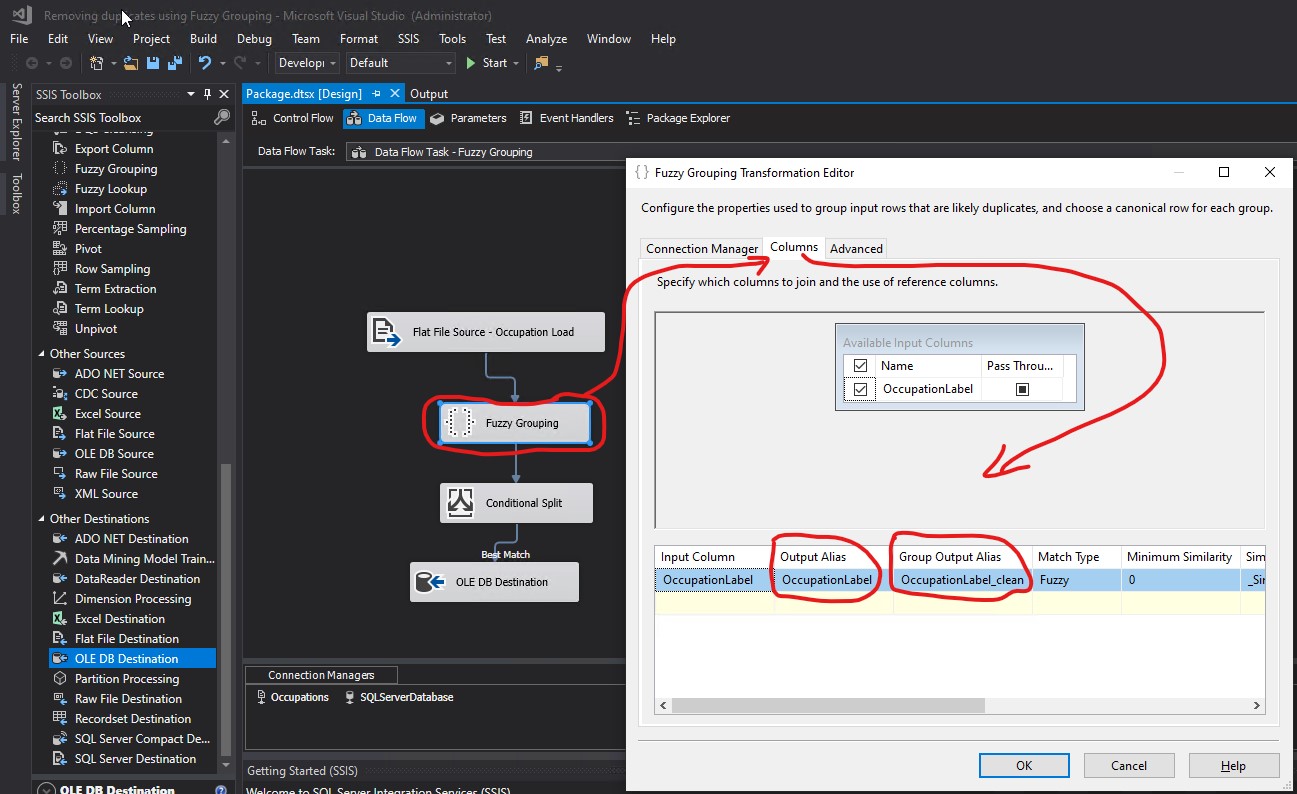
I clicked the Columns tab:
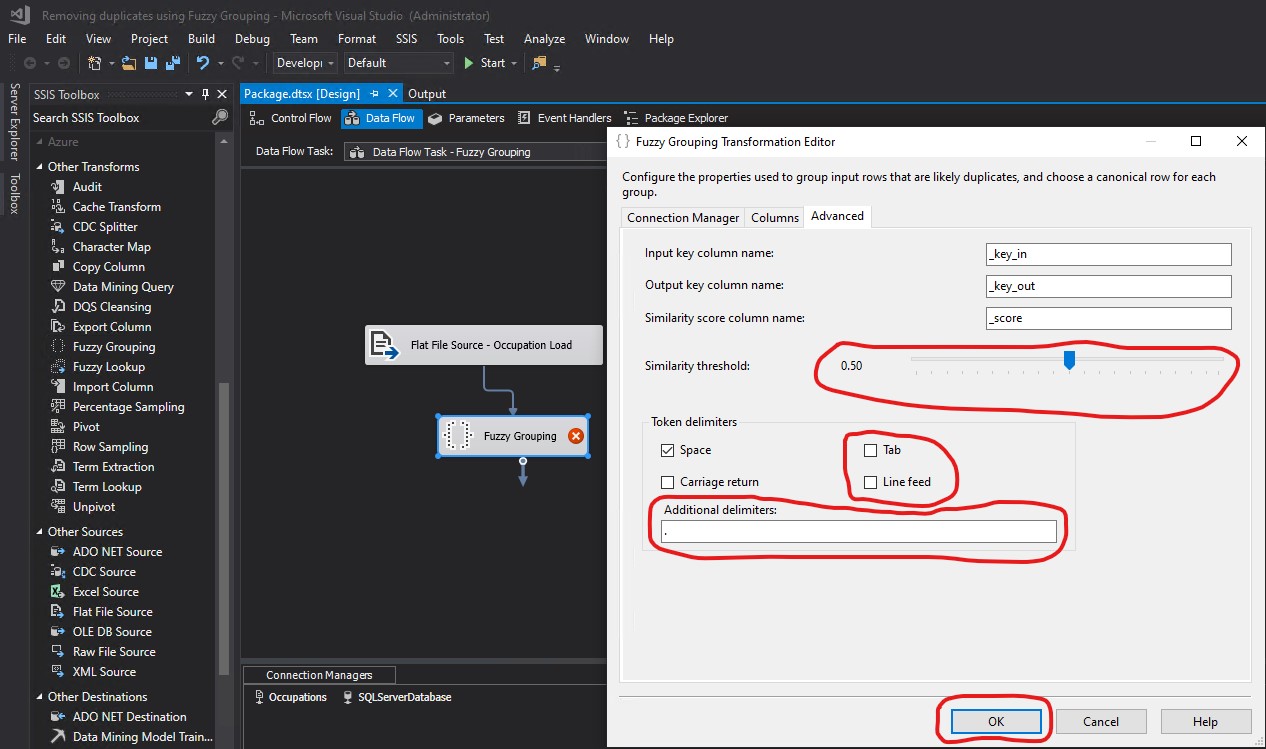
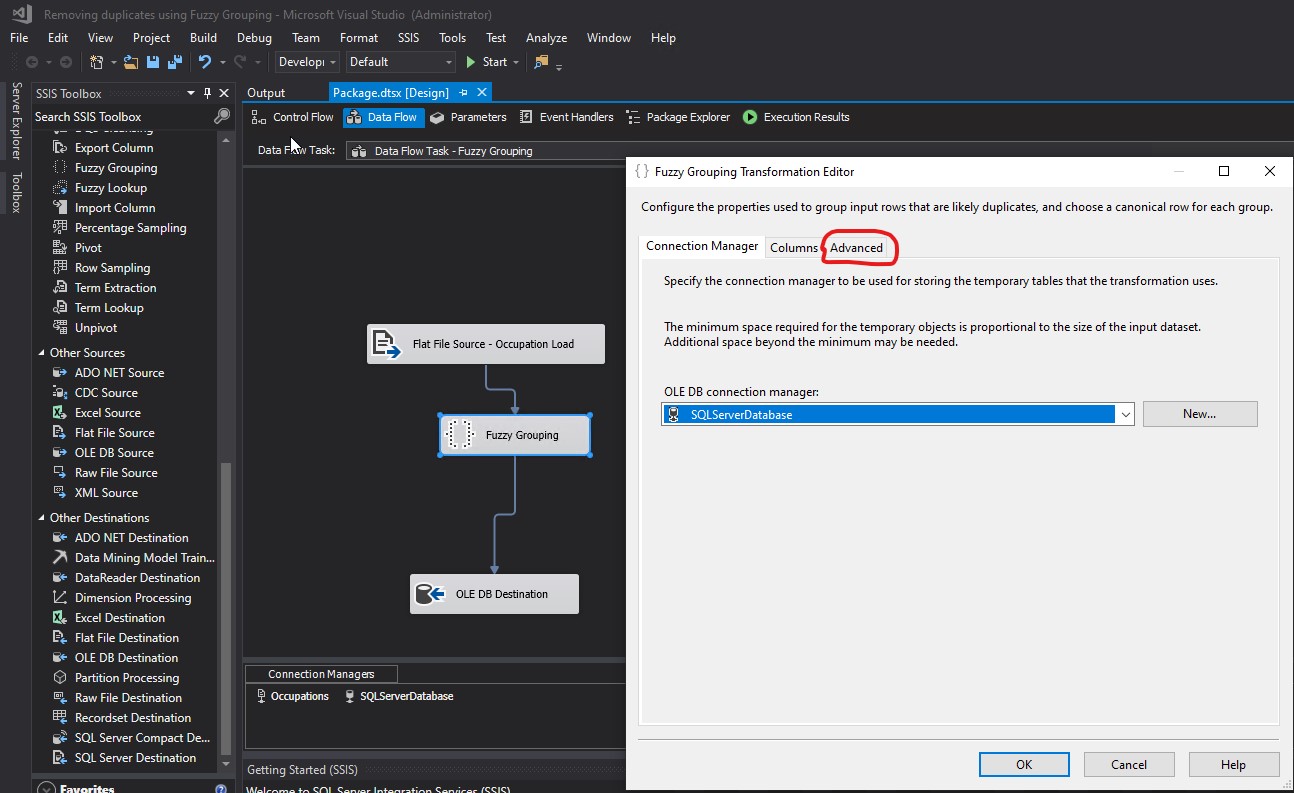
I checked OccupationLabel and clicked the Advanced tab:
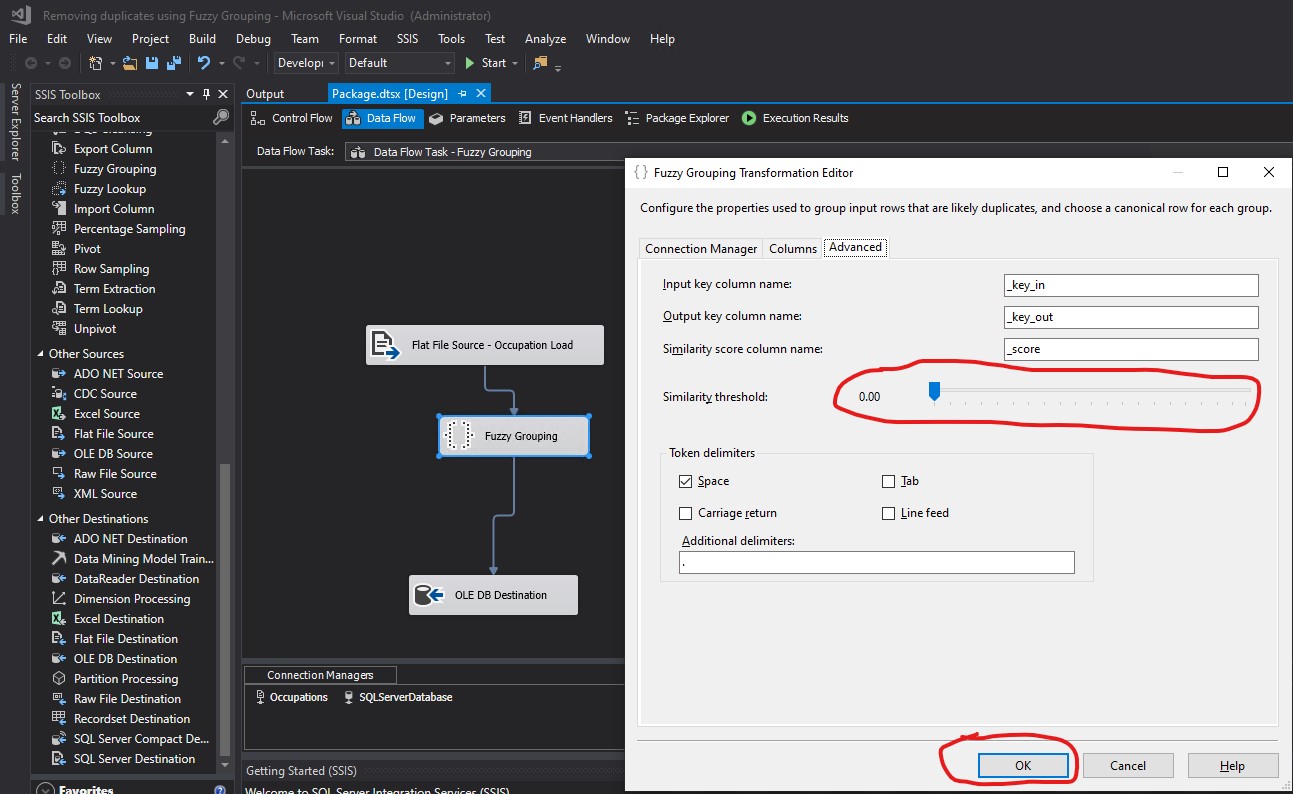
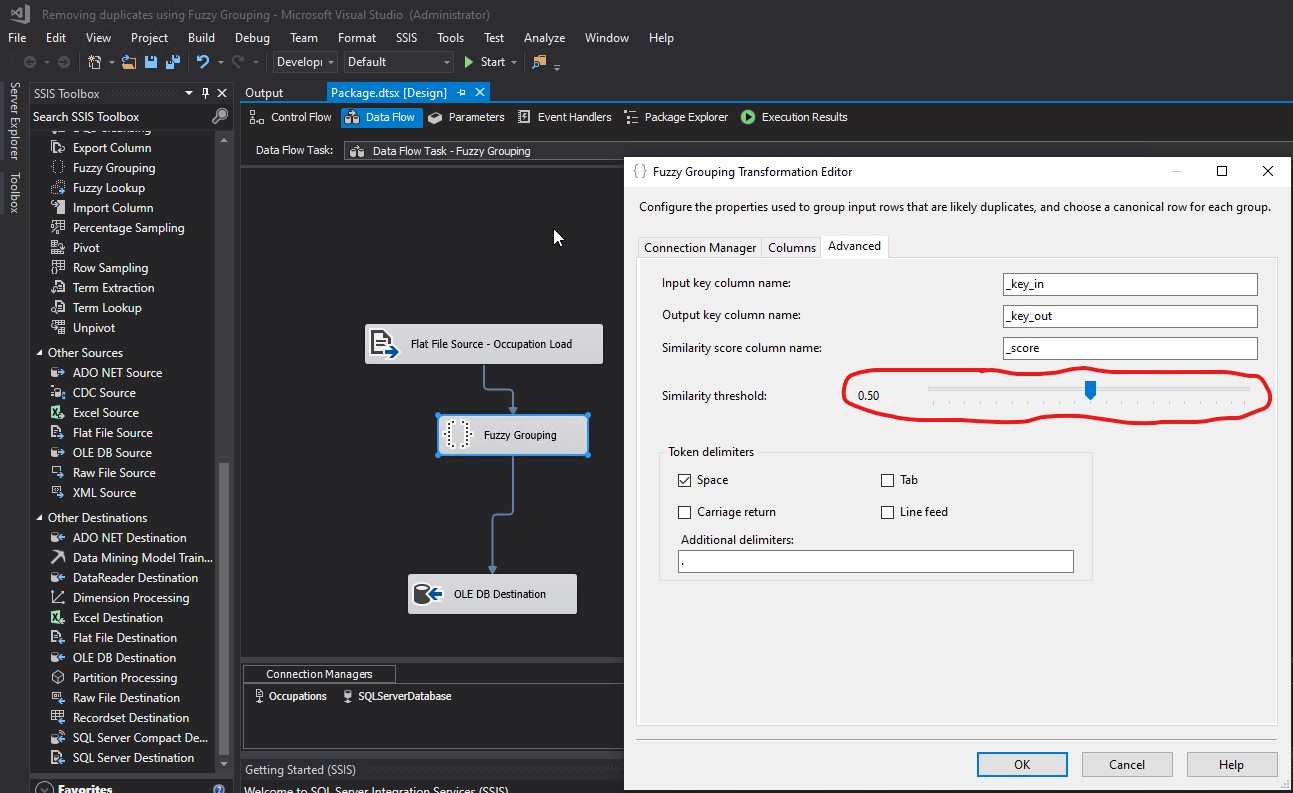
I unchecked the Tab and Line feed Token delimiters. I replaced ,.;:-"'&/\@!?()<>[]{}|#*^% with . in the Additional delimiters textbox. I knew I had spaces and periods in the values of the TITLE column of my FuzzyGroupingExample.txt file. For that reason, I included both spaces and periods as Token delimiters in my configurations. Since I knew I did not have any other special characters in my data, I did not specify additional Token delimiters. I changed the Similarity threshold from 0.8 to 0.5. Finally, I clicked OK.
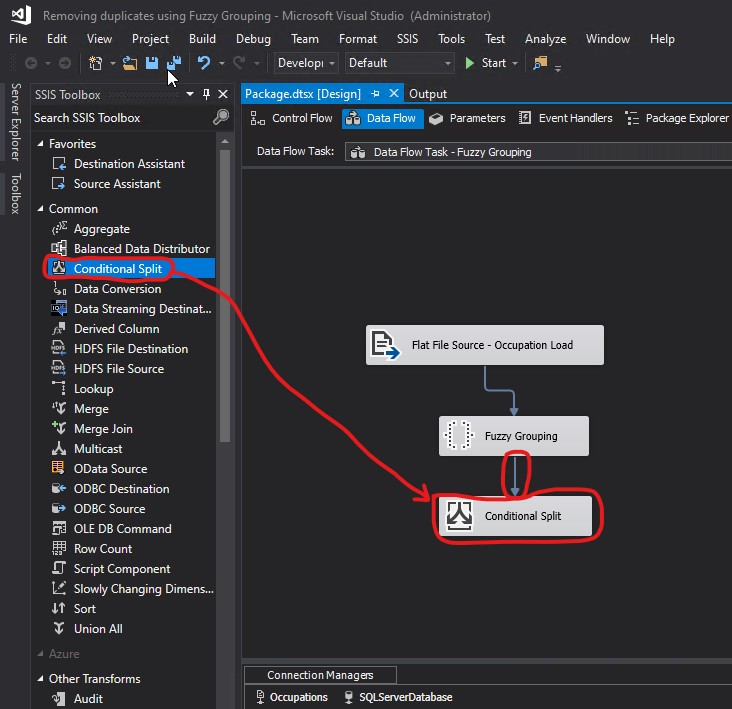
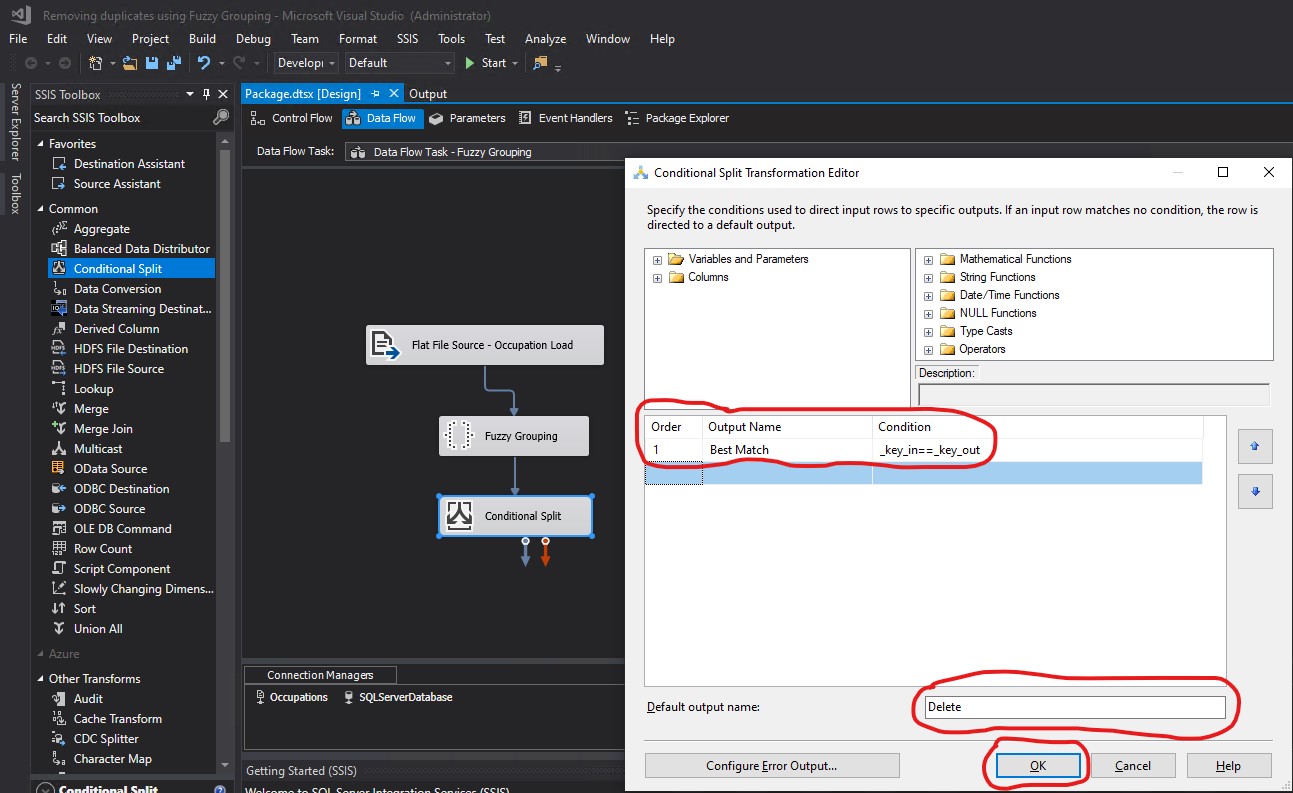
In order to specify which rows to return, I used the Conditional Split Transformation. Each of those returned rows represent groups. For example, CUST SERVICE REP., CUSTOMER SERVICE REPRESENTATIVE, CUSTOMER SERVICE REP, CUTSOMER SERIVCE REPRESENTATIVE, and CUSTOMER SERIVCE REP are all part of the same group whose only returned row is CUSTOMER SERVICE REPRESENTATIVE. I created a Conditional Split Transformation and connected the arrow from Fuzzy Grouping to Conditional Split. Then I double clicked Conditional Split:
I specified my condition in the Default output name textbox. I replaced Conditional Split Default Output with Delete. Then I clicked OK:
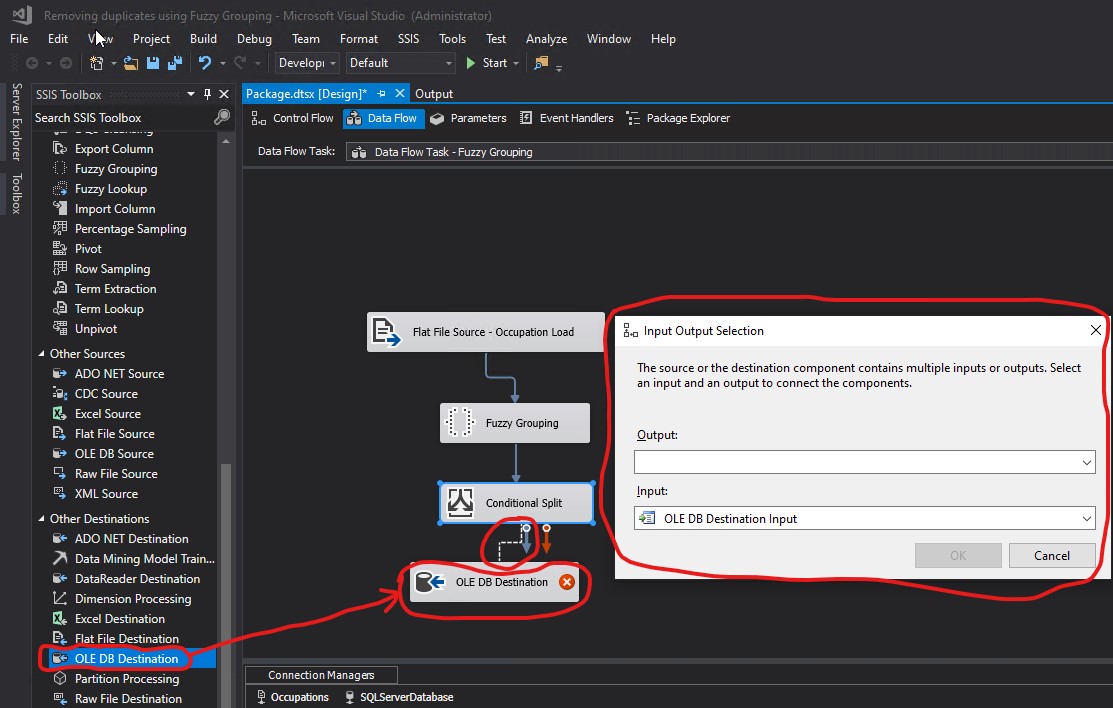
I created an OLE DB Destination and connected the arrow from Conditional Split to OLE DB Destination. The Input Output Selection pop-up appeared:
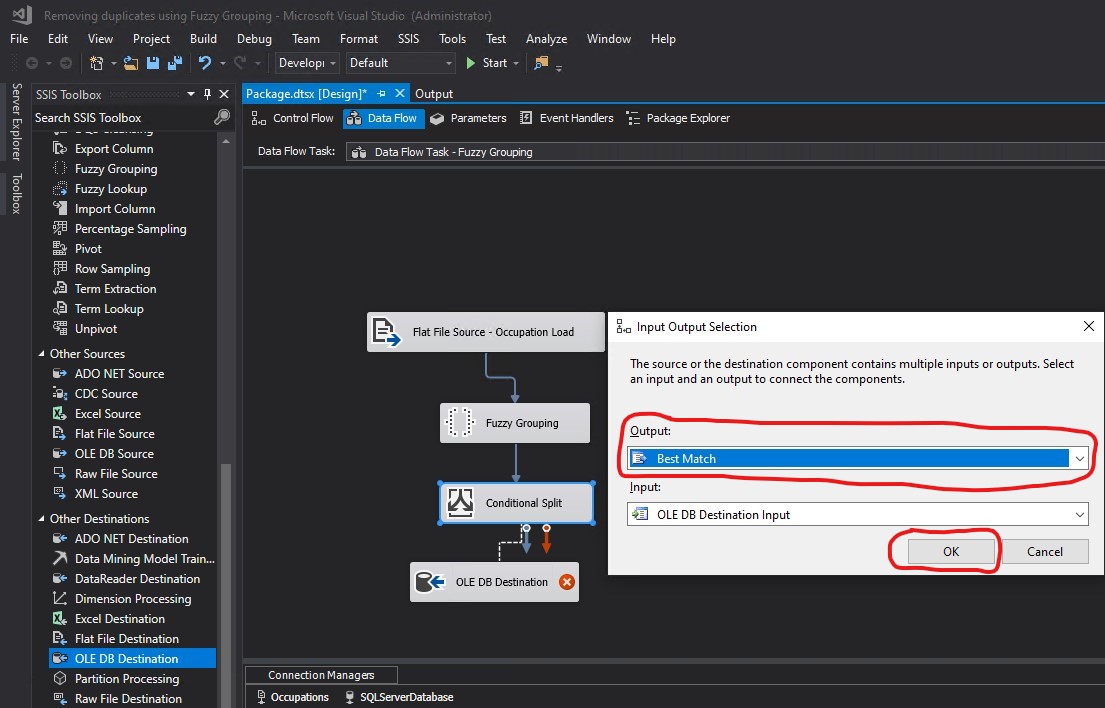
I chose Best Match as my Output and clicked OK:
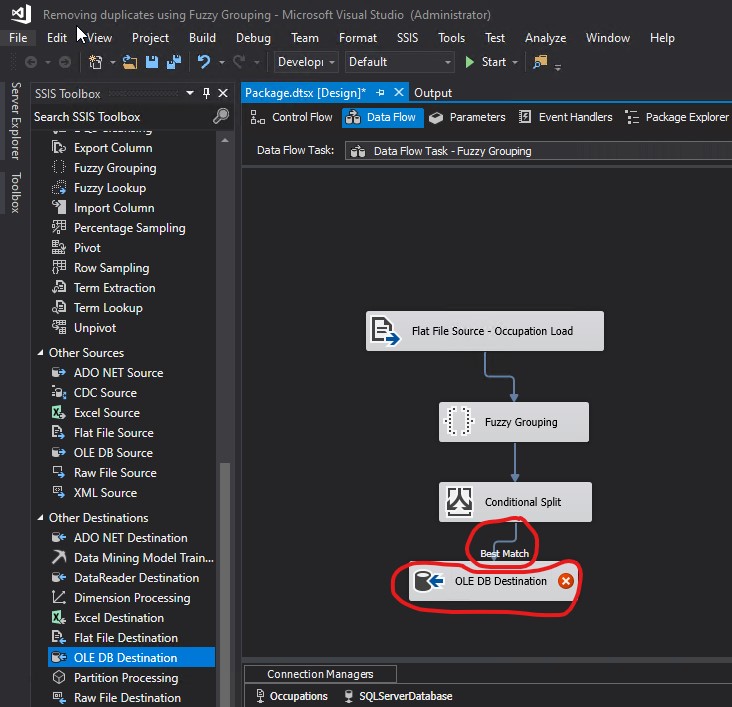
The arrow from Conditional Split to OLE DB Destination appeared correctly with the Best Match label on it. I double clicked OLE DB Destination to open it:
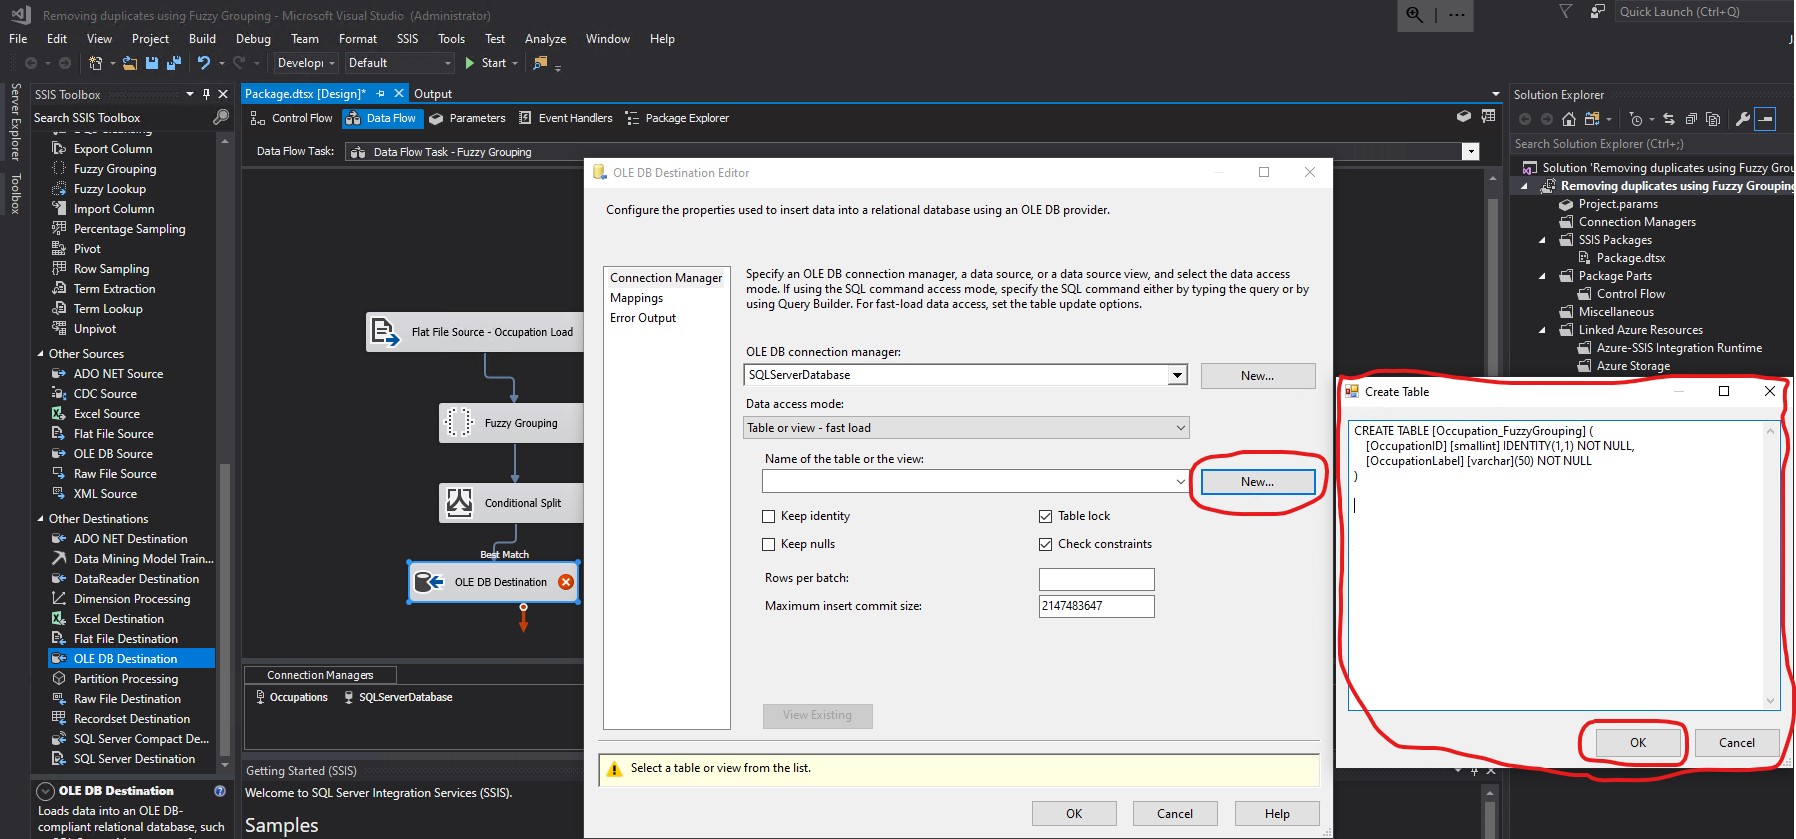
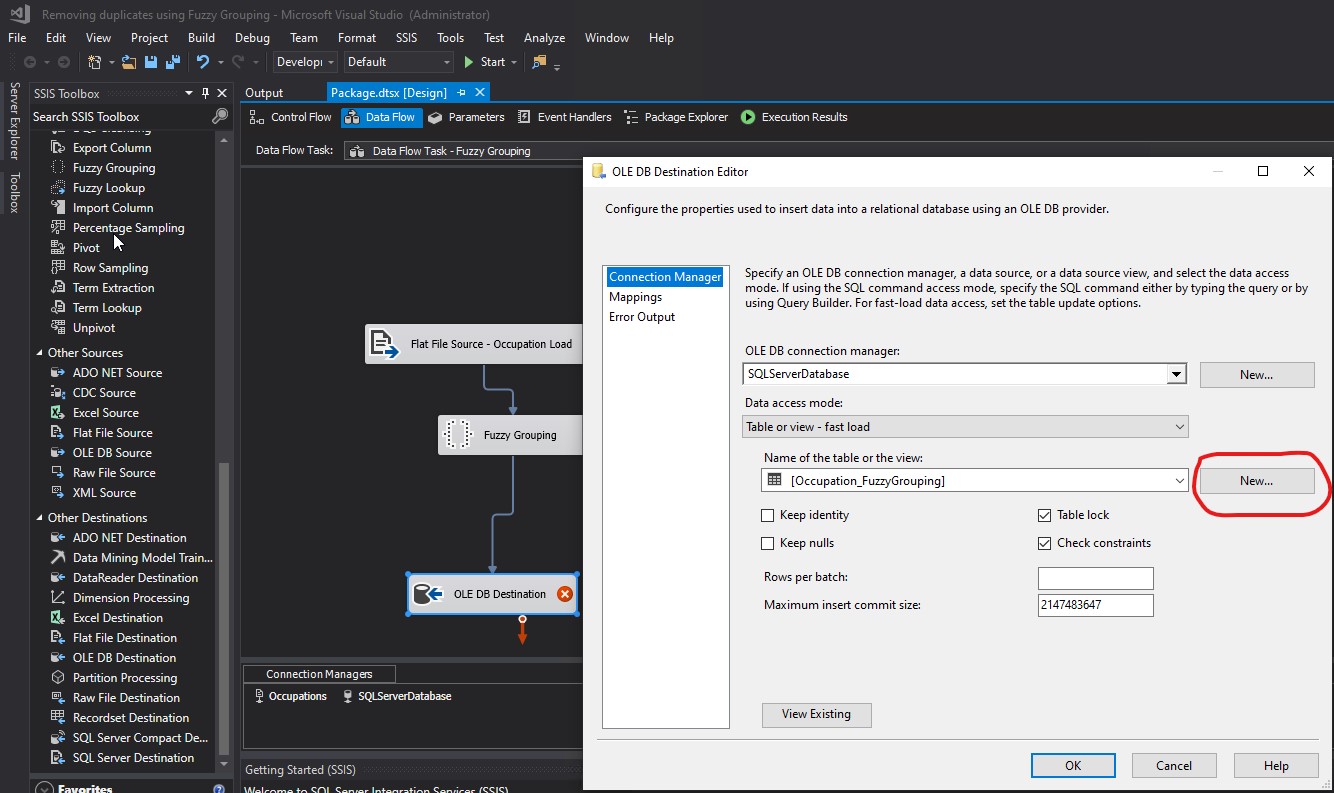
I clicked the New... button and in the Create Table box, I provided the code to create the destination table to hold the final output. Then I clicked OK:
CREATE TABLE [Occupation_FuzzyGrouping] (
  [OccupationID] [smallint] IDENTITY(1,1) NOT NULL,
  [OccupationLabel] [varchar](50) NOT NULL
)
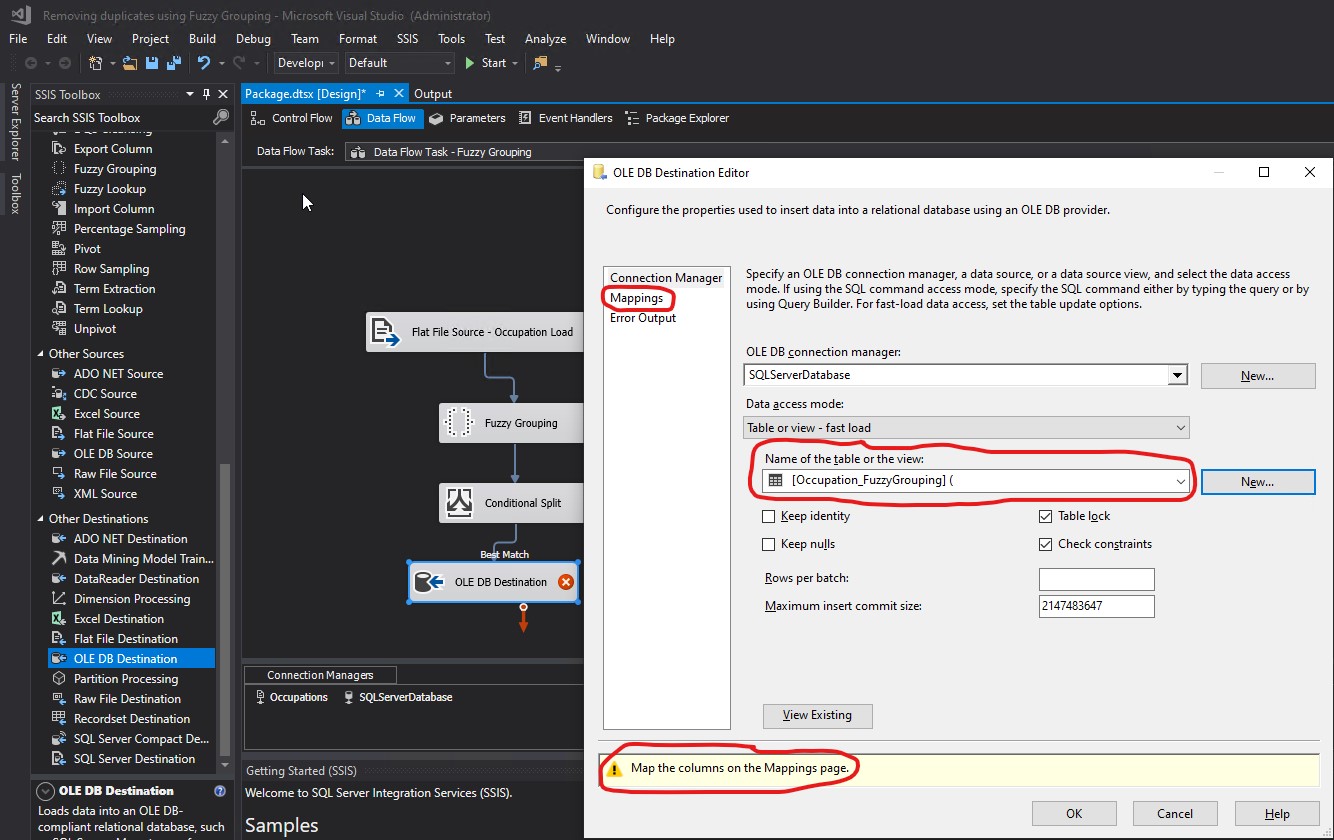
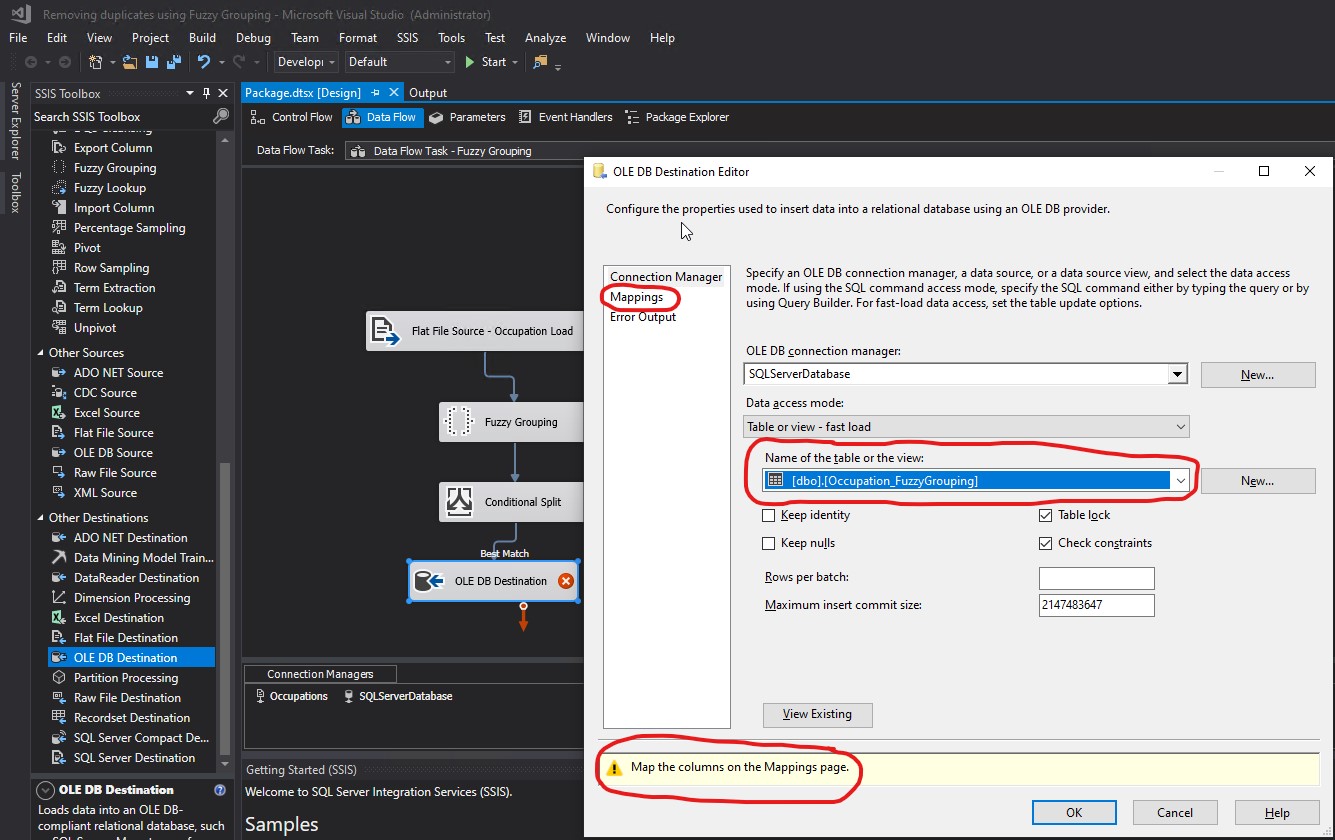
Name of the table or the view did not seem to have been populated properly. What I saw was [Occupation_FuzzyGrouping] (. That opening parenthesis did not look correct as part of a table or view name. I clicked Mappings. Notice the warning: Map the columns on the Mappings page.
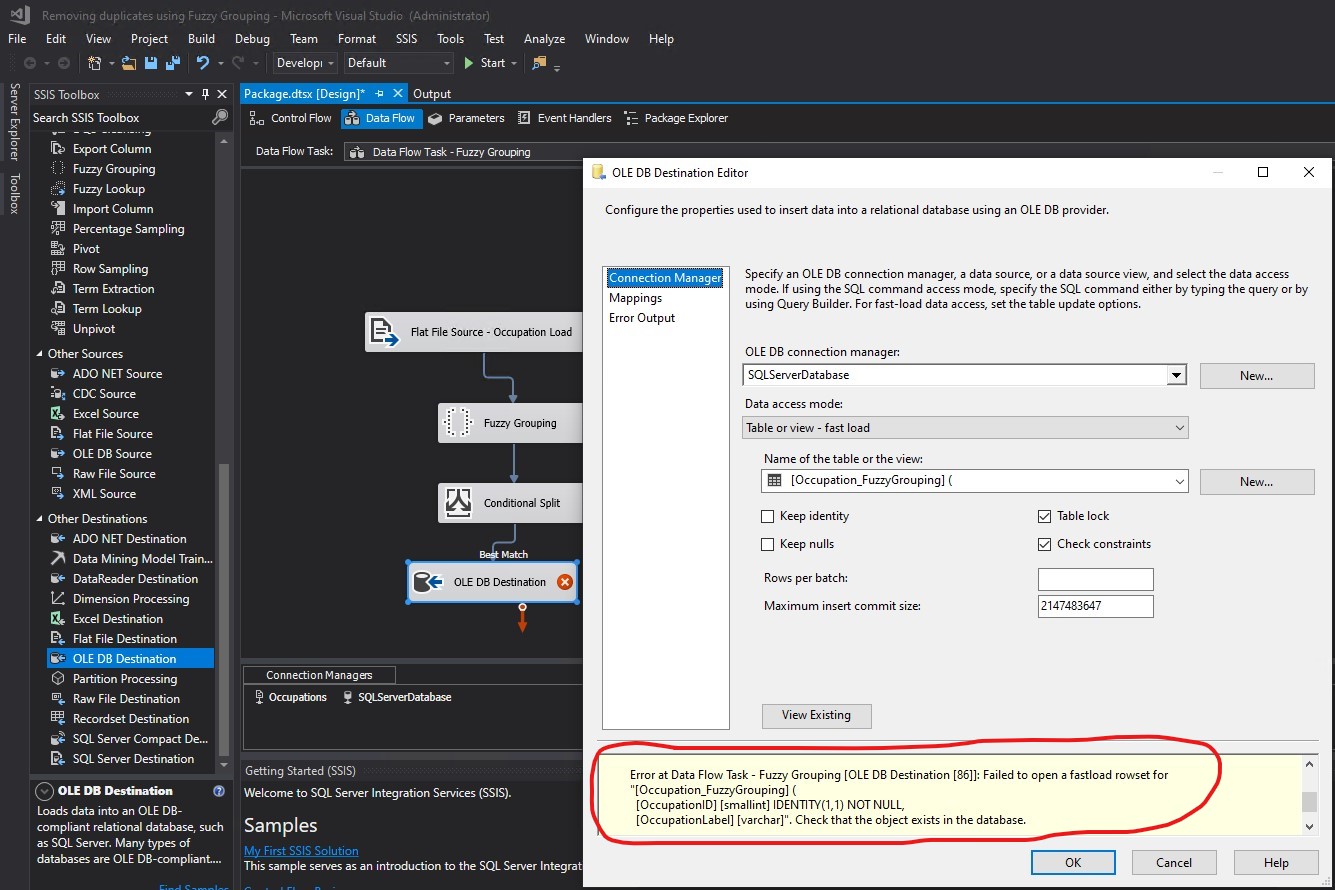
I was not allowed to go to the Mappings section. The following warning appeared.
Warning when trying to navigate to Mappings (part 1 of 2):
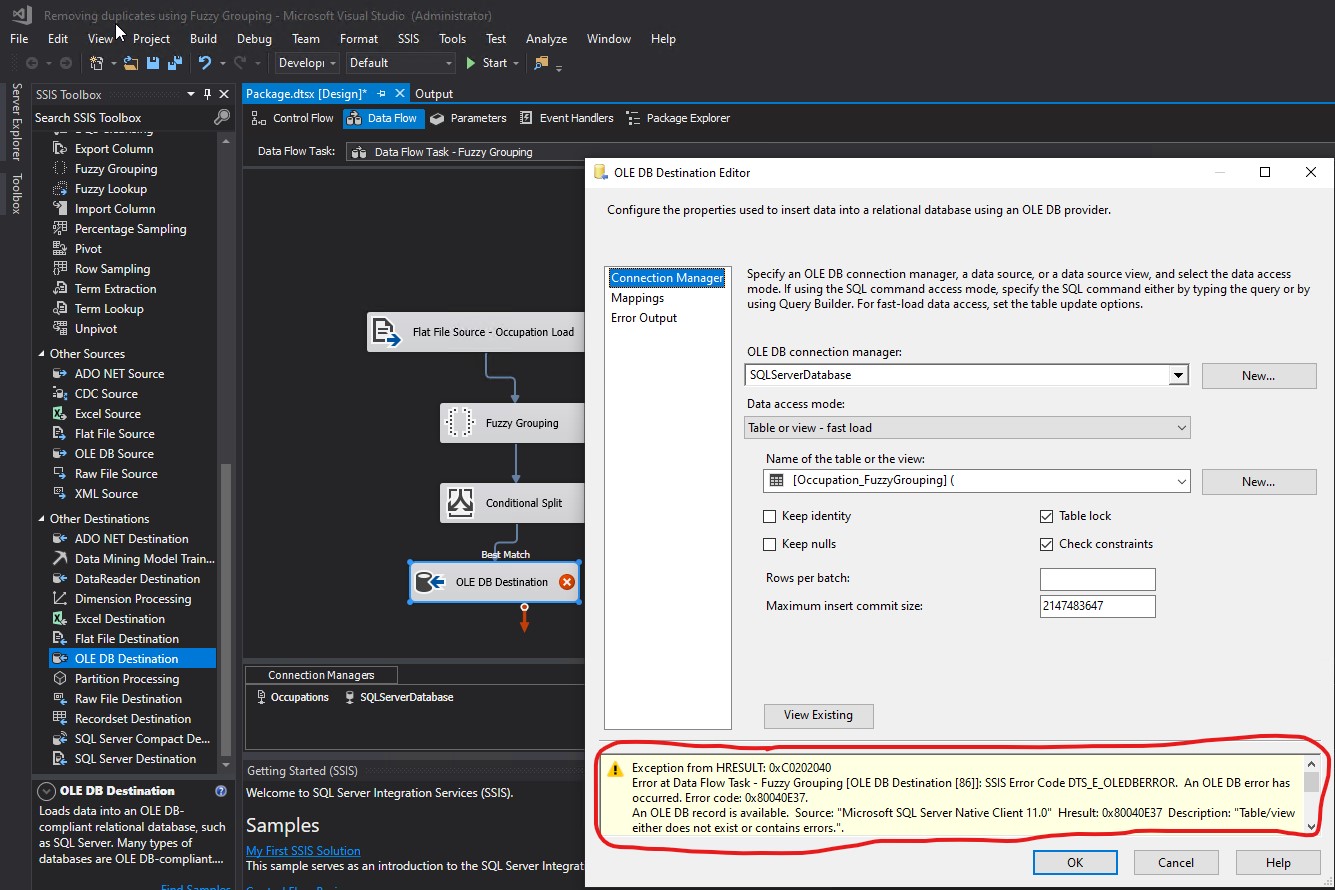
Warning when trying to navigate to Mappings (part 2 of 2):
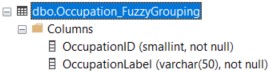
I went to the database and discovered that the table had been created successfully:
In the value for Name of the table or the view, I replaced [Occupation_FuzzyGrouping] ( with [dbo].[Occupation_FuzzyGrouping]. The warning changed back to Map the columns on the Mappings page. Then I clicked Mappings:
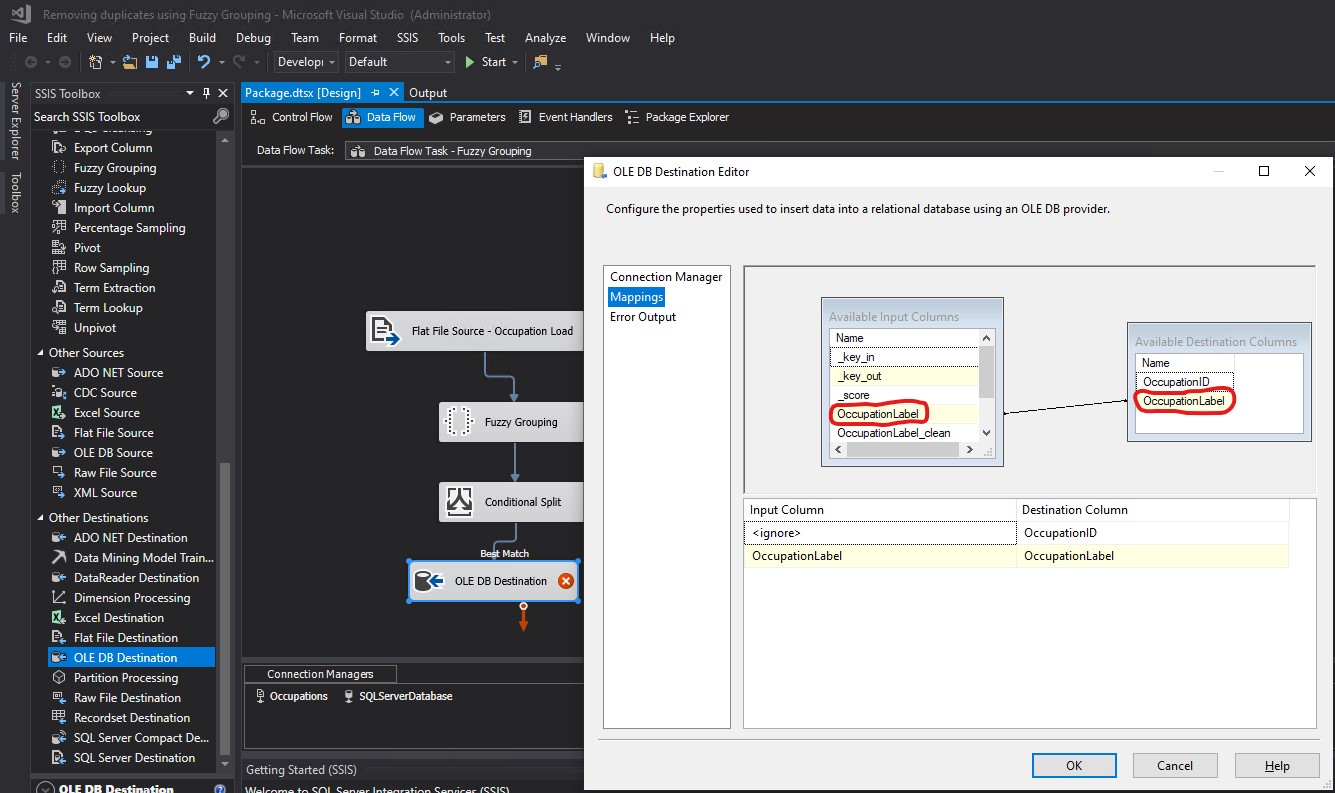
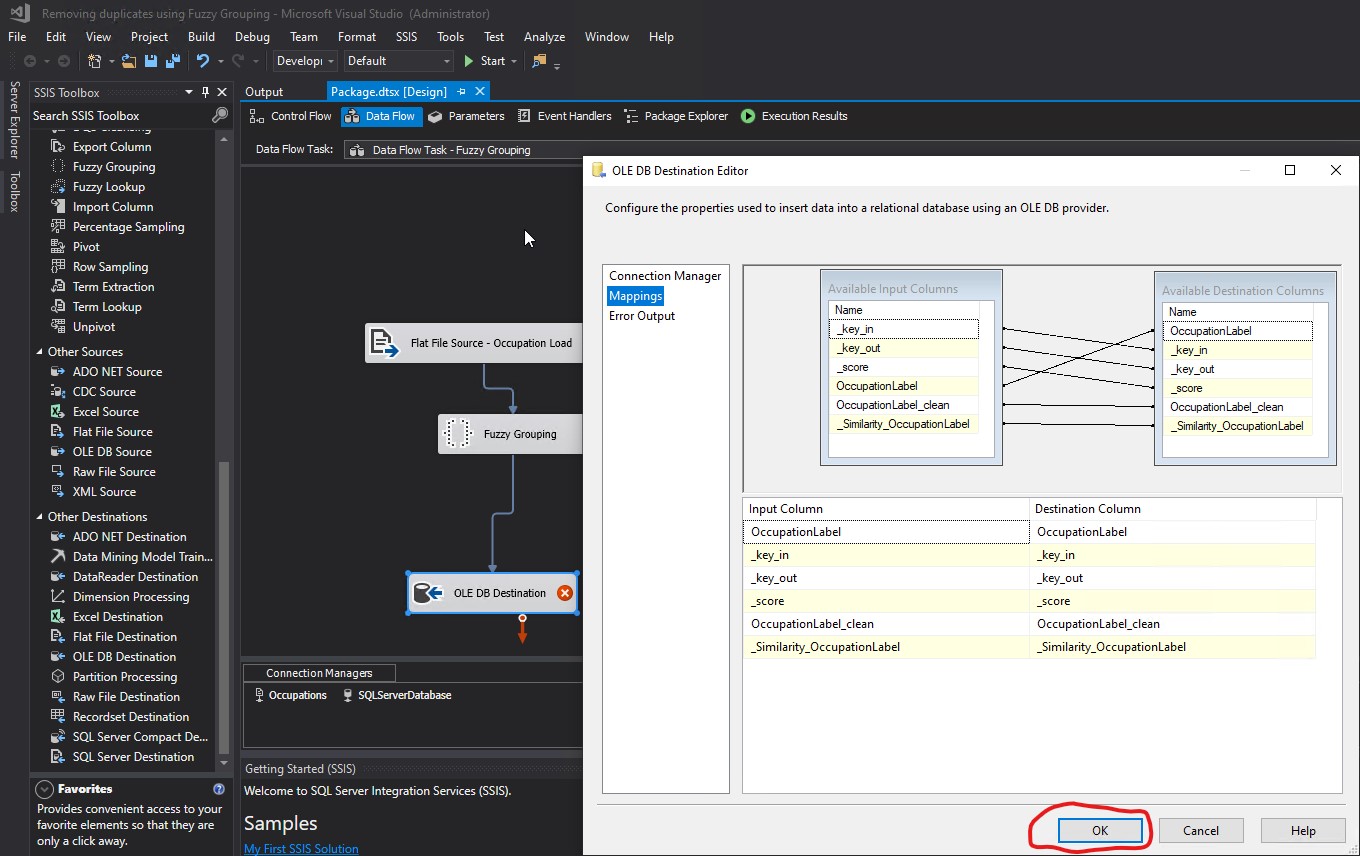
The mapping was wrong because it was linking OccupationLabel from Available Input Columns to OccupationLabel from Available Destination Columns:
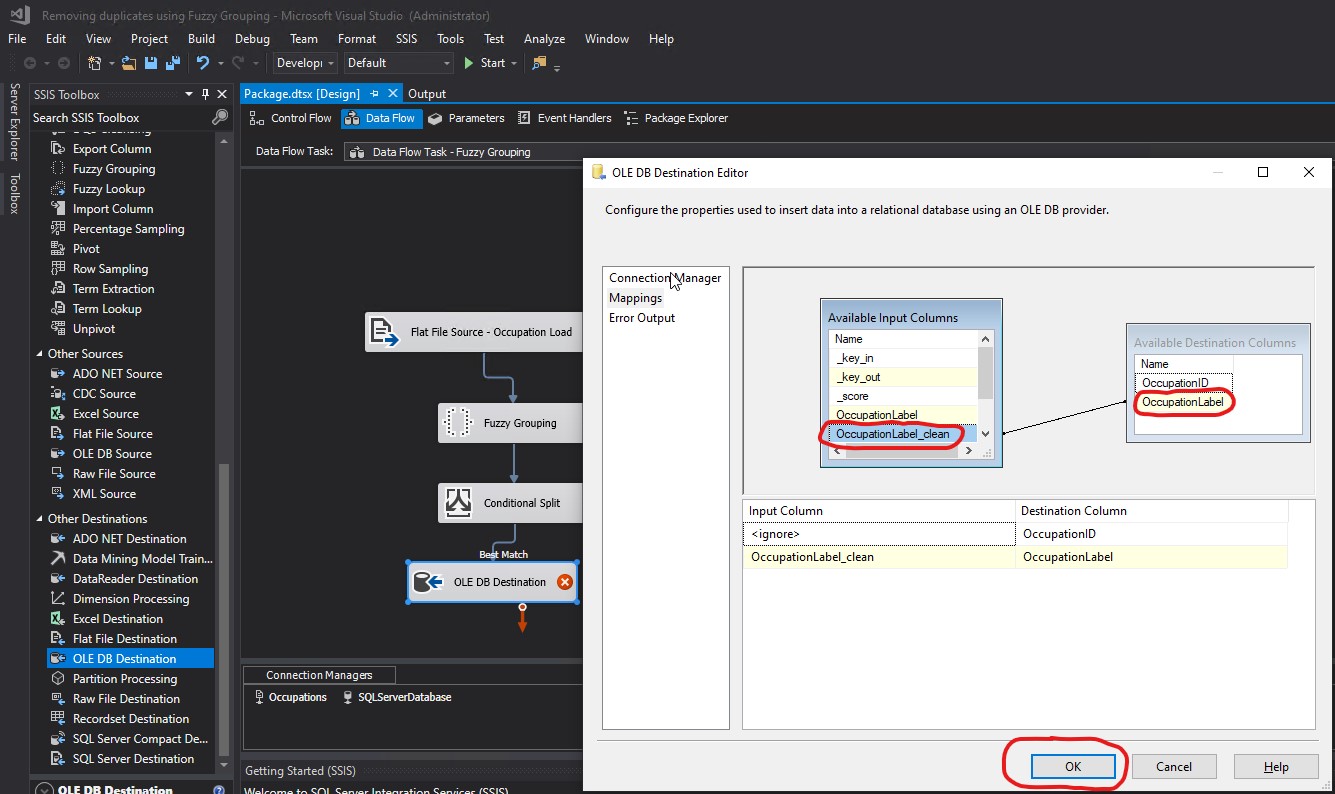
I fixed the mappings by linking OccupationLabel_clean from Available Input Columns to OccupationLabel from Available Destination Columns. Then I clicked OK:
The explanation of why the mapping was wrong and it had to be fixed, was because the OccupationLabel Output Alias returns several rows, while OccupationLabel_clean Group Output Alias returns the grouping of all those rows. For example, OccupationLabel Output Alias would return CUST SERVICE REP., CUSTOMER SERVICE REPRESENTATIVE, CUSTOMER SERVICE REP, CUTSOMER SERIVCE REPRESENTATIVE, and CUSTOMER SERIVCE REP; while OccupationLabel_clean Group Output Alias would only return CUSTOMER SERVICE REPRESENTATIVE:
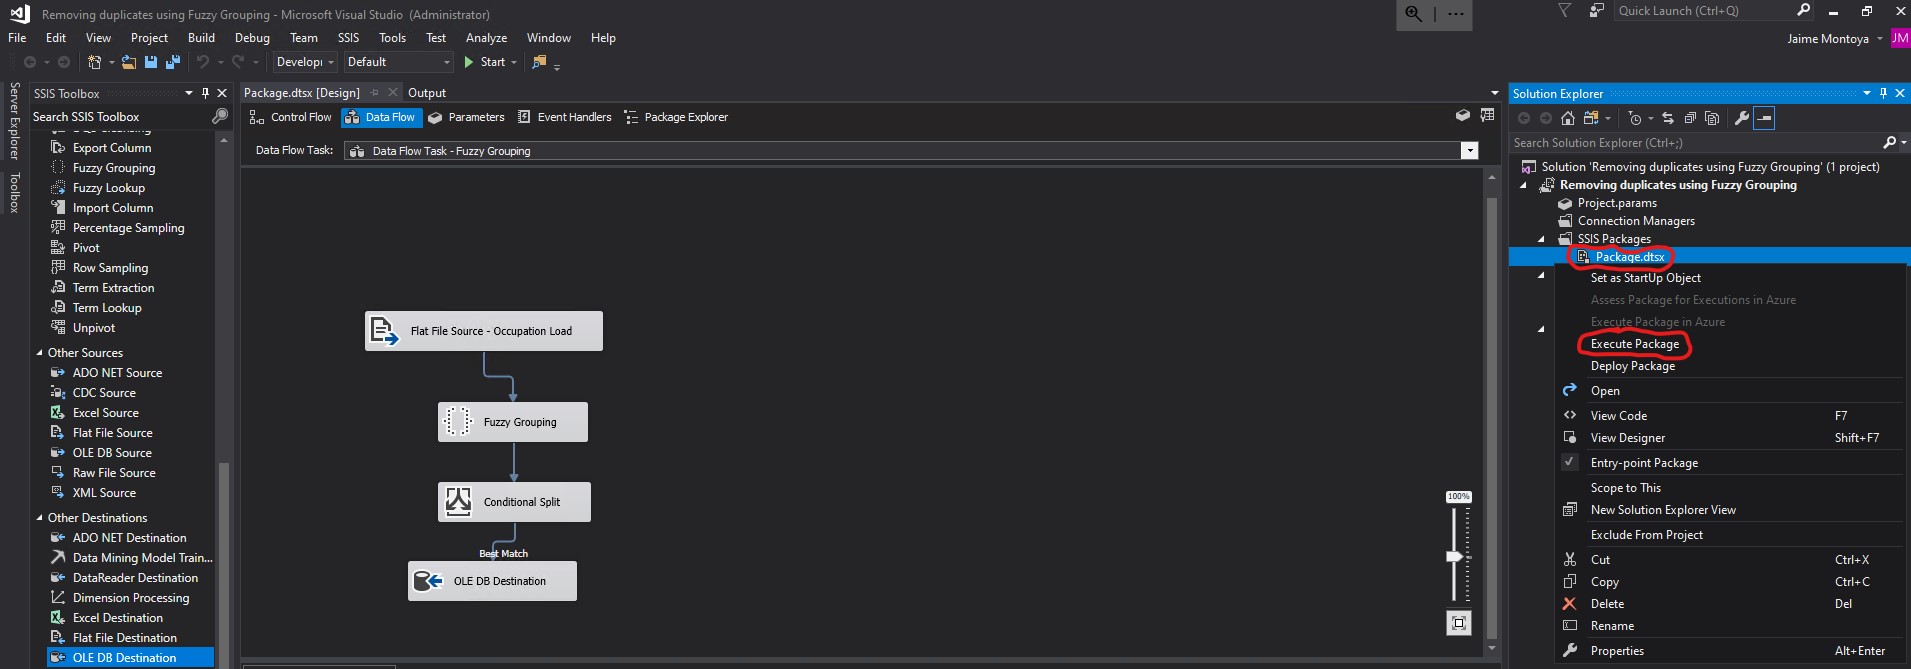
I right clicked on the package and then clicked Execute Package:
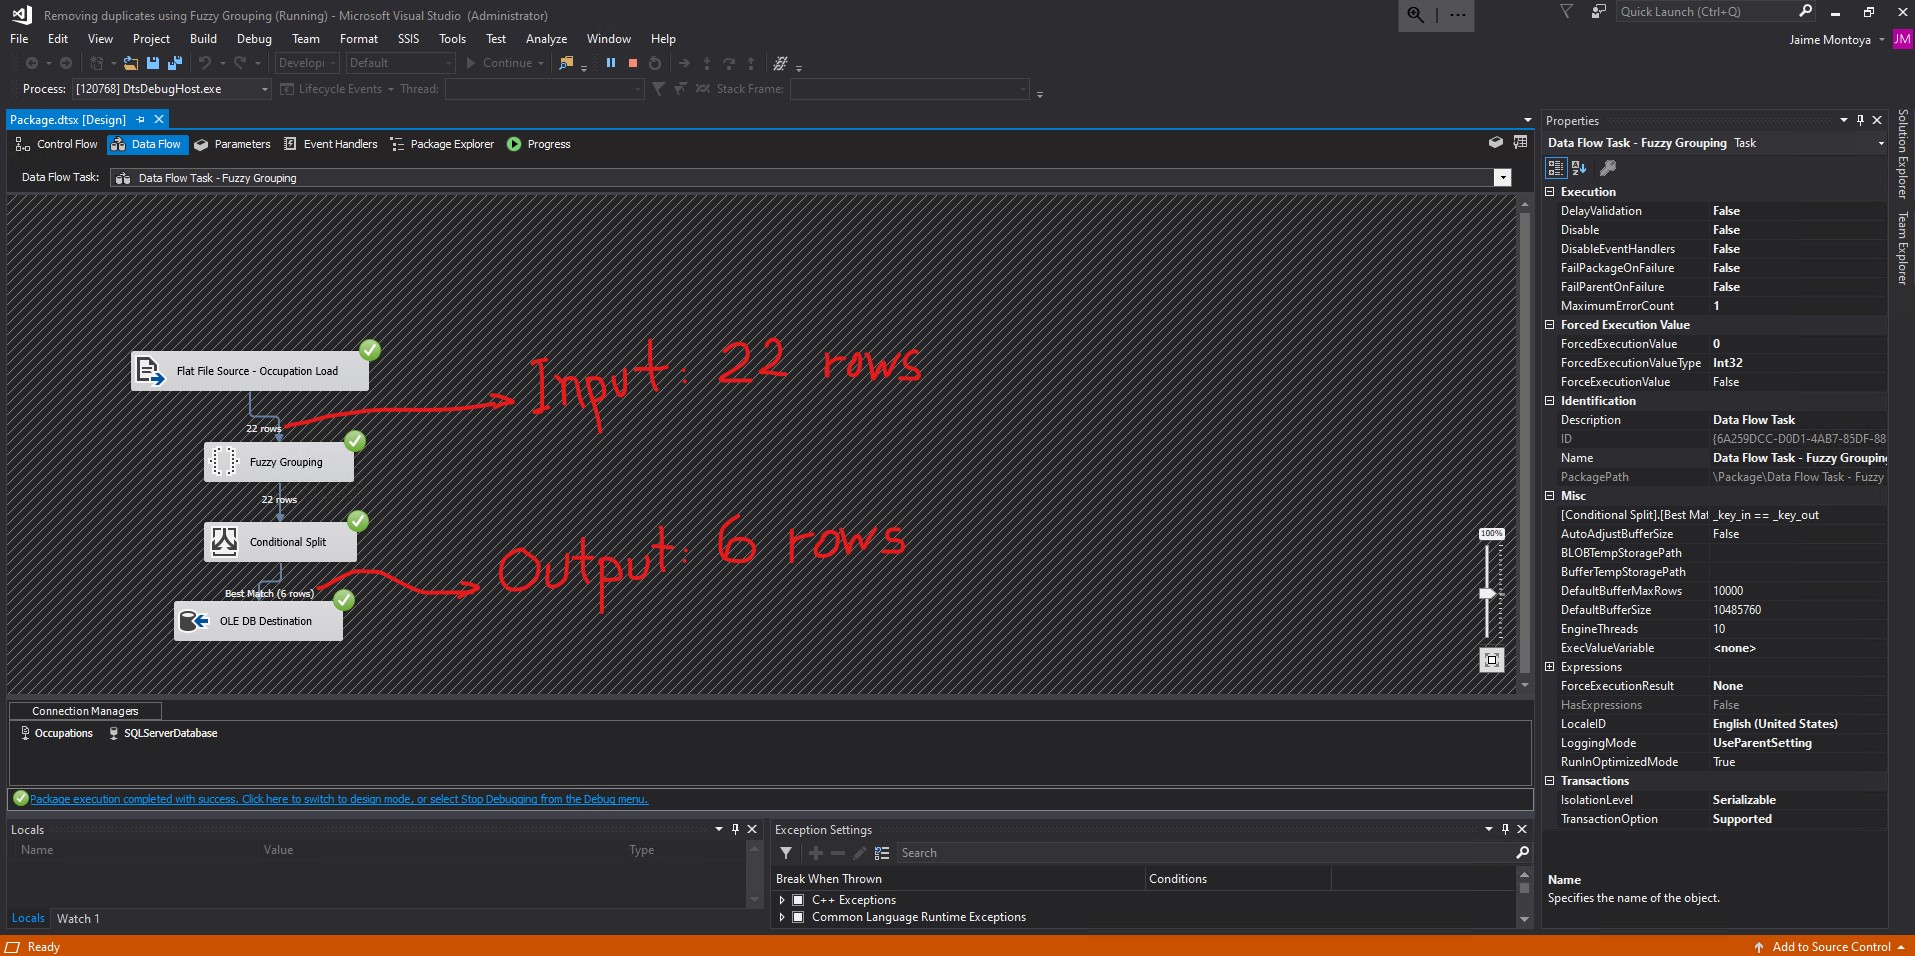
The execution was successful, returning 6 rows from the original input of 22 rows:
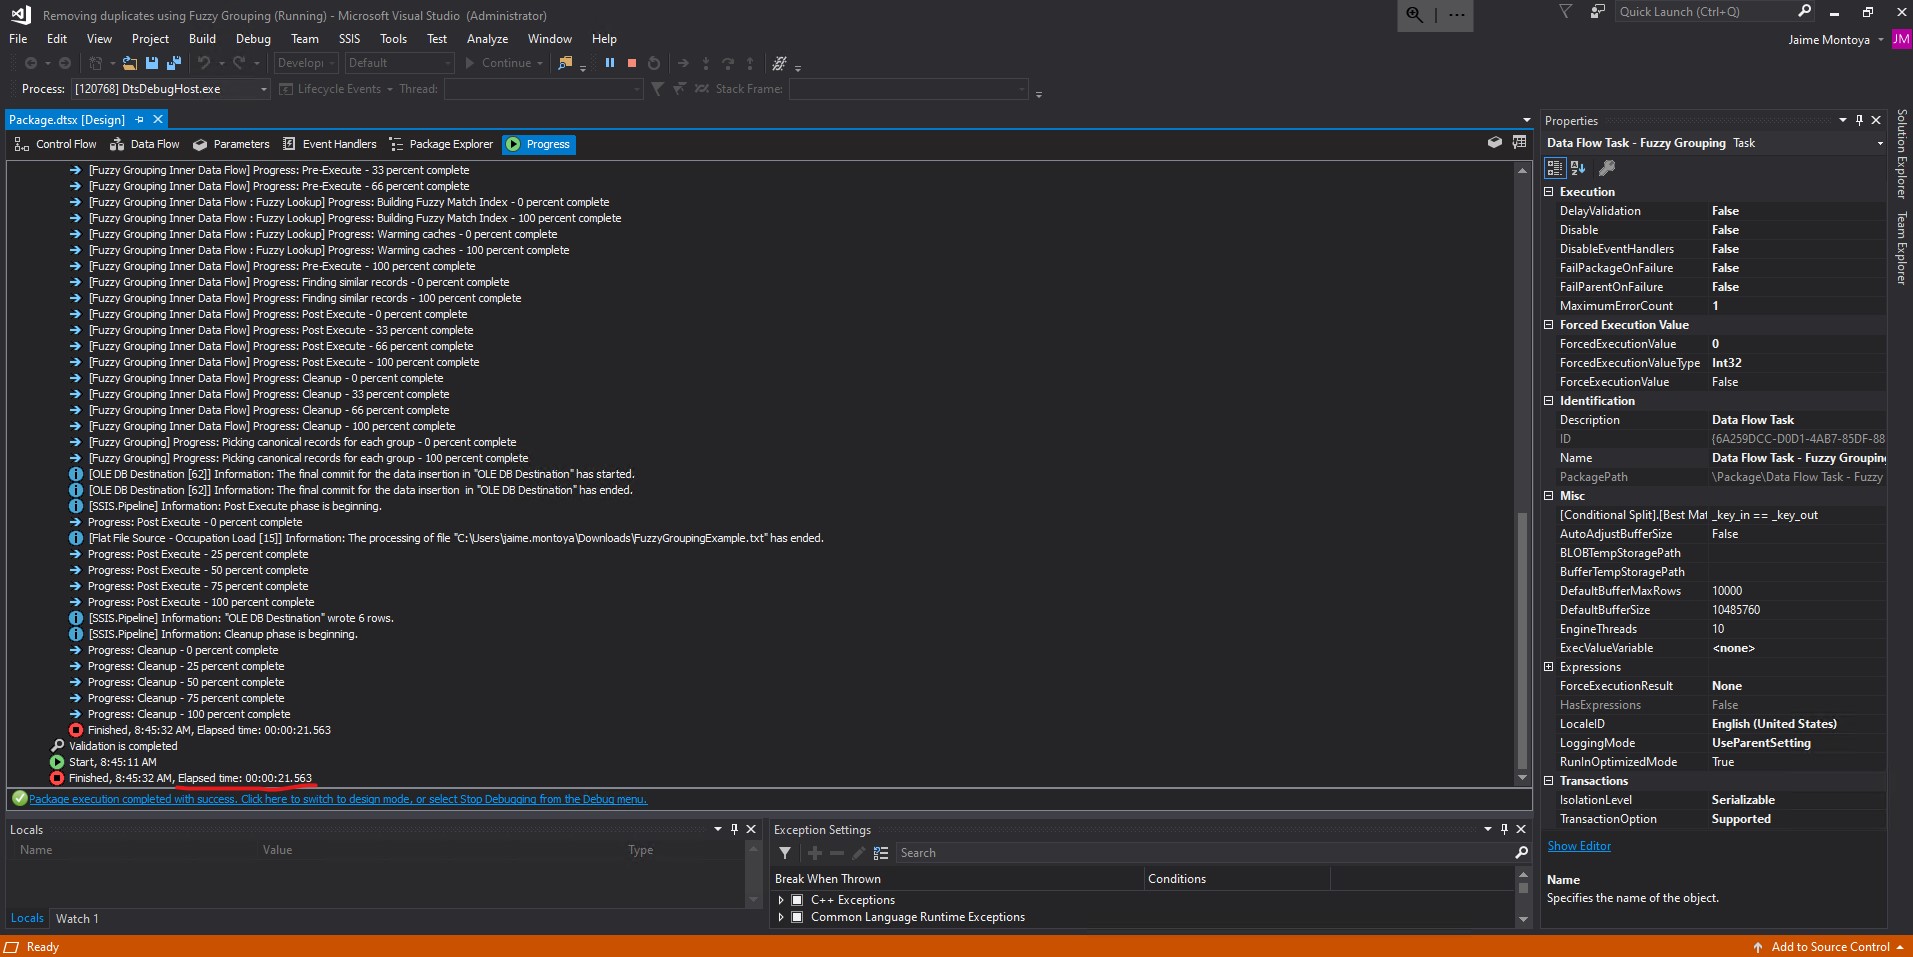
I clicked Progress and scrolled all the way down to see how the execution was completed successfully. Its elapsed time was 21.563 seconds:
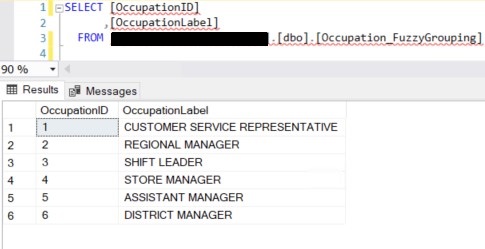
The final output contains only 6 rows, without duplicates, which were written to the database:
What happens behind the scenes? In order to find out, I deleted the Conditional Split Transformation. I connected Fuzzy Grouping to OLE DB Destination. Then I double clicked Fuzzy Grouping:
I clicked the Advanced tab:
I changed the Similarity threshold to 0.00 and clicked OK:
I deleted my Occupation_FuzzyGrouping table that I had previously used as my destination of final results.
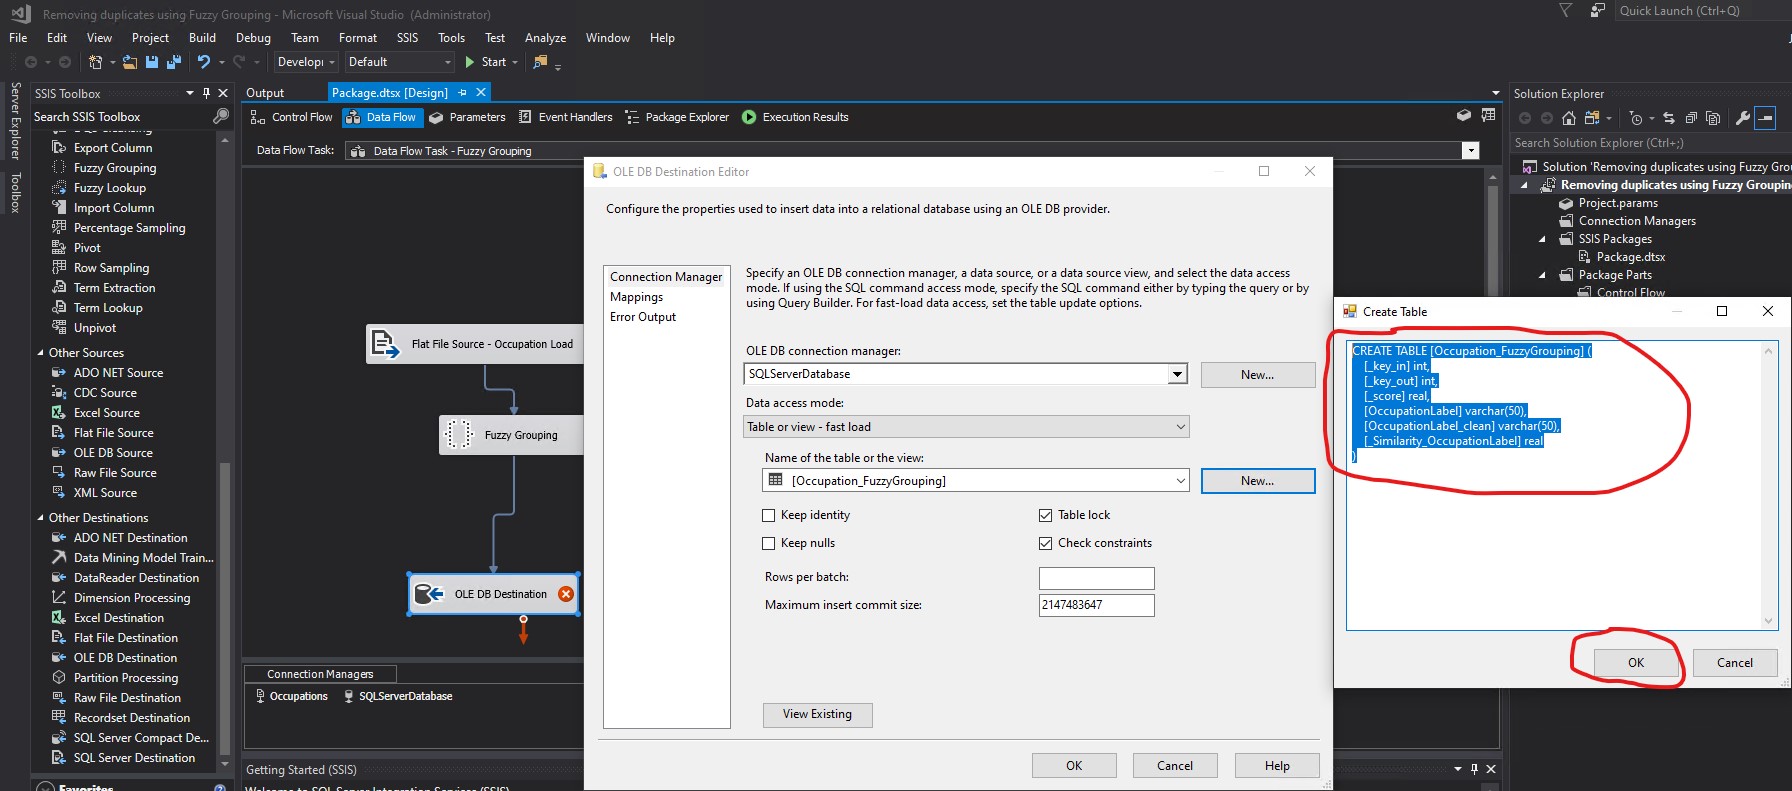
After deleting it, I created a table with the same name, but with another set of fields. In order to do that, I started by double clicking OLE Destination DB: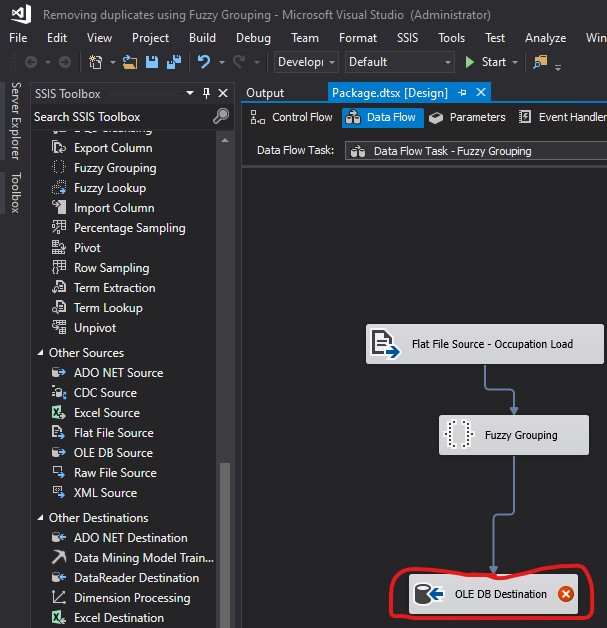
I clicked New...:
I provided the following code in the Create Table pop-up box:
CREATE TABLE [Occupation_FuzzyGrouping] (
  [_key_in] int,
  [_key_out] int,
  [_score] real,
  [OccupationLabel] varchar(50),
  [OccupationLabel_clean] varchar(50),
  [_Similarity_OccupationLabel] real
)
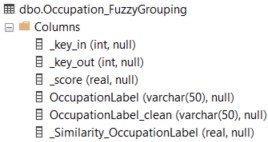
I clicked OK. As soon as the OK button was clicked, the new table was created in the database:
I confirmed from the database that my table was created successfully:
I clicked Mappings:
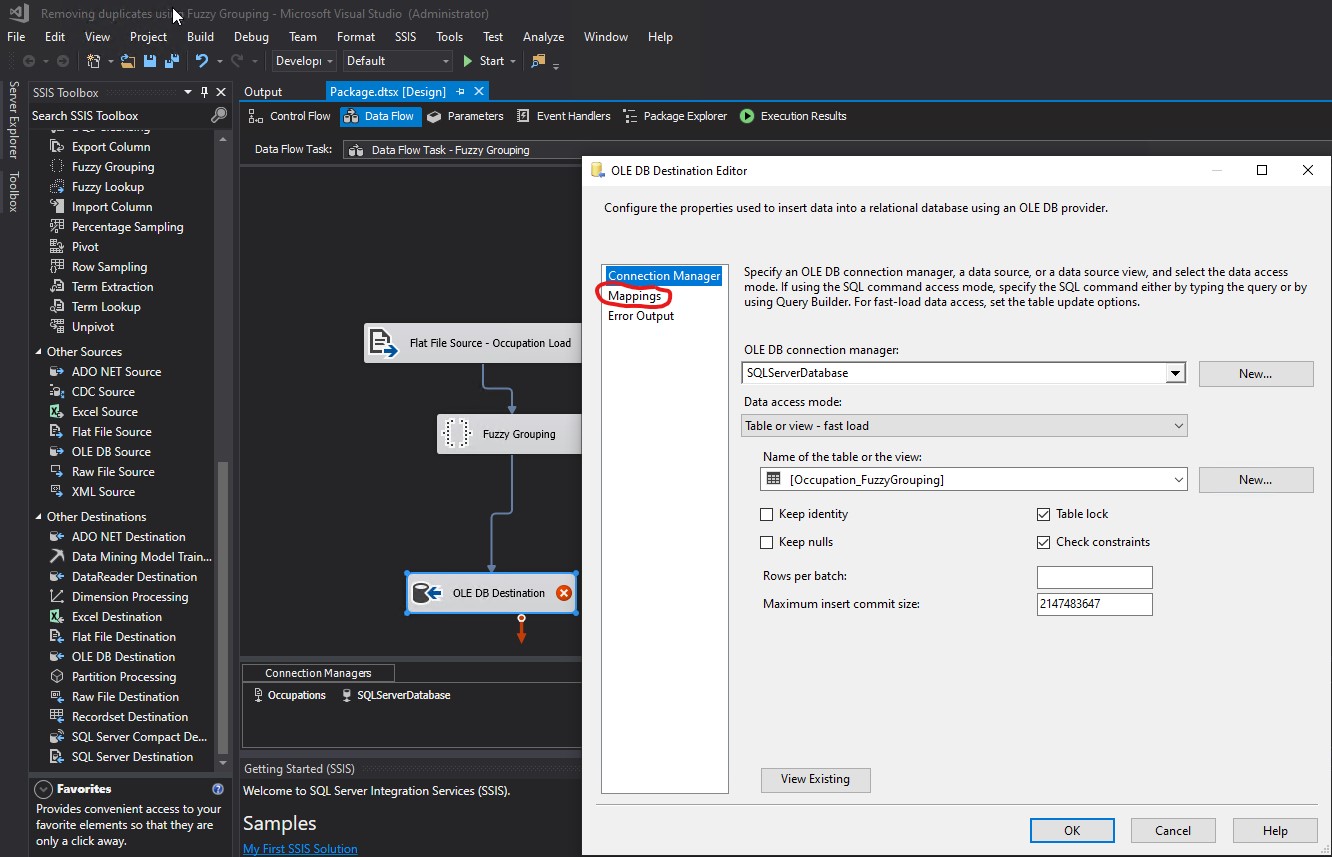
I did not change anything. The mappings were already correct as I needed it, autimatically done by the tool based on exactly matching names. I clicked OK:
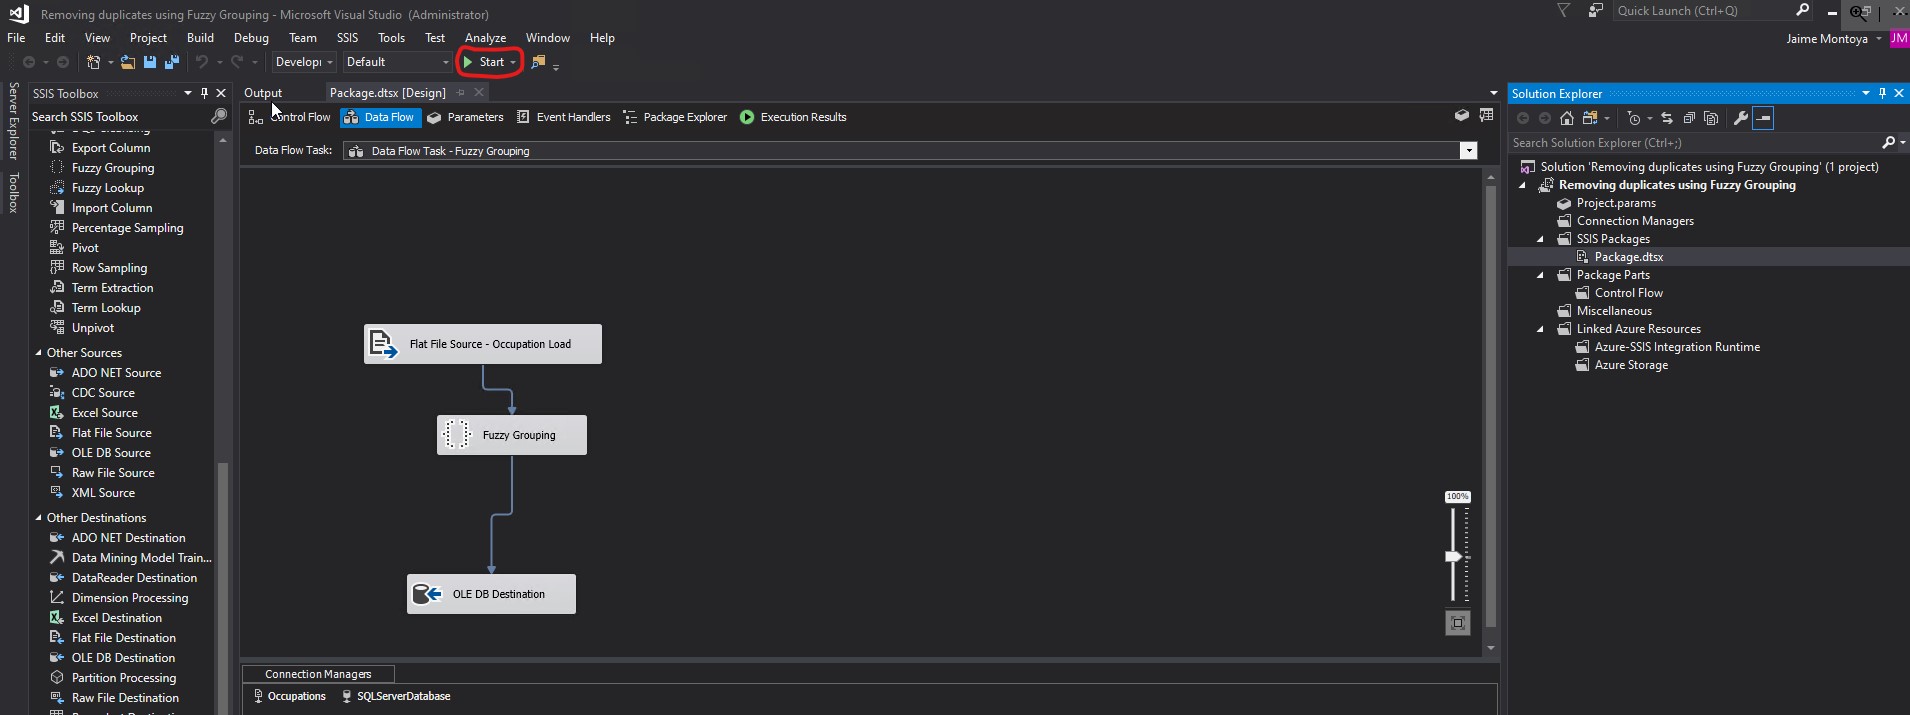
Click Start to execute the package:
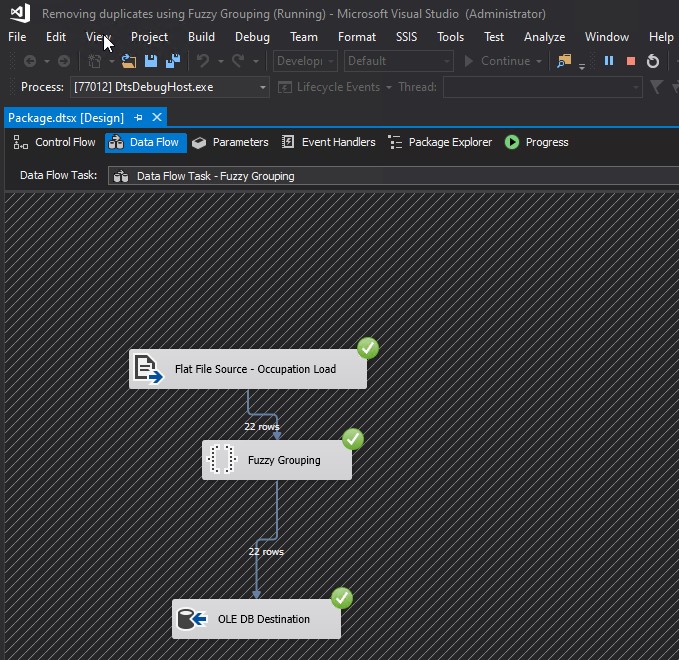
From an input of 22 rows, the output is also 22 rows:
This was the result in the database:
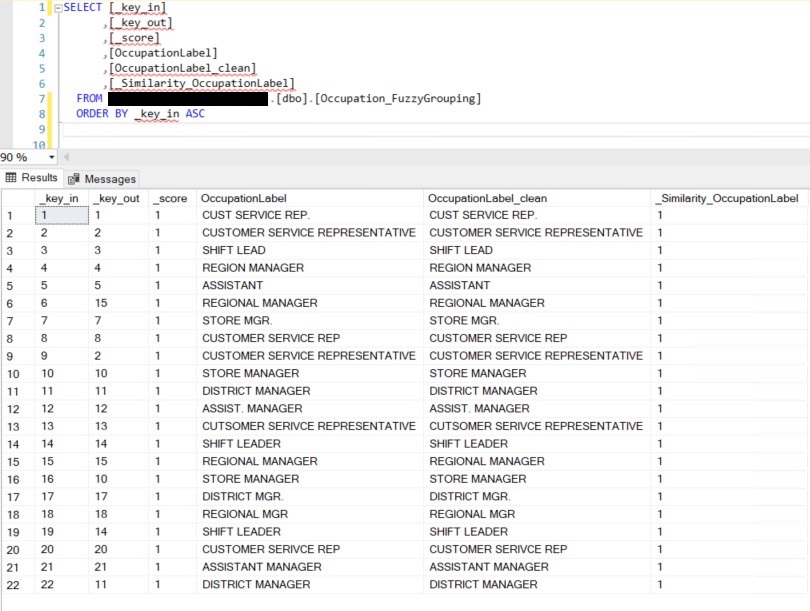
I deleted all rows from the Occupation_FuzzyGrouping table. I changed the Similarity threshold to 0.99:

I executed the package again. This was the new result in the database:
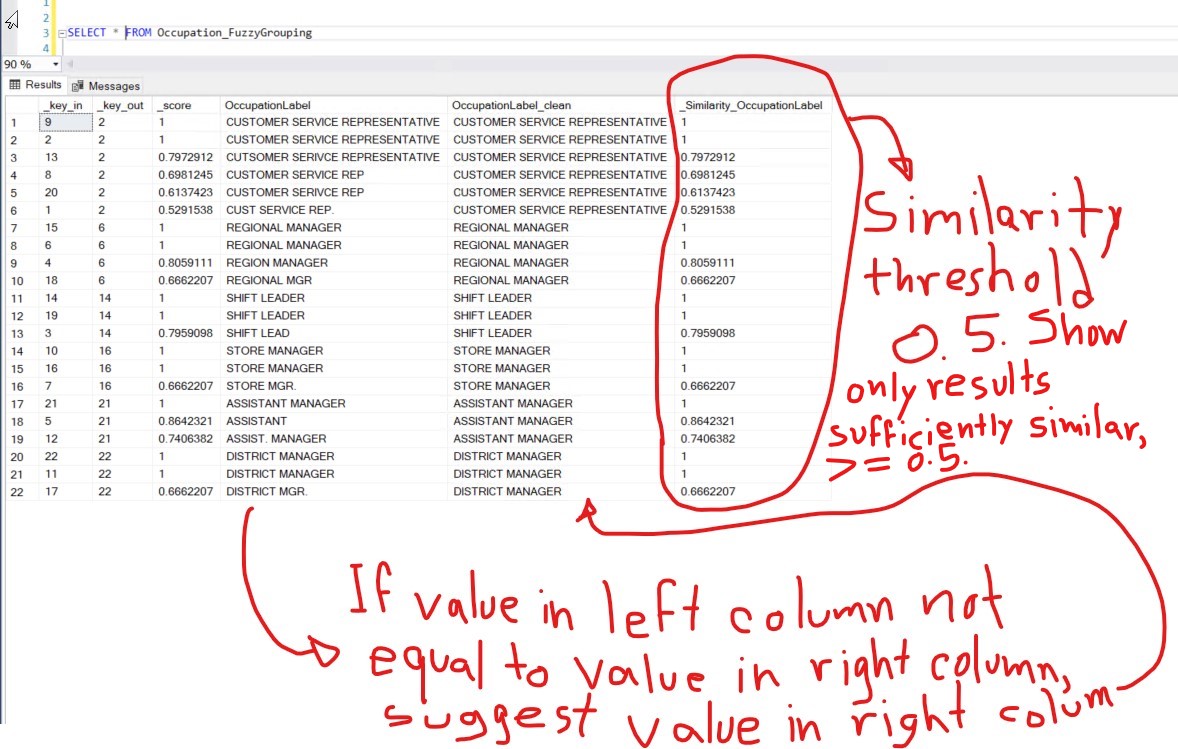
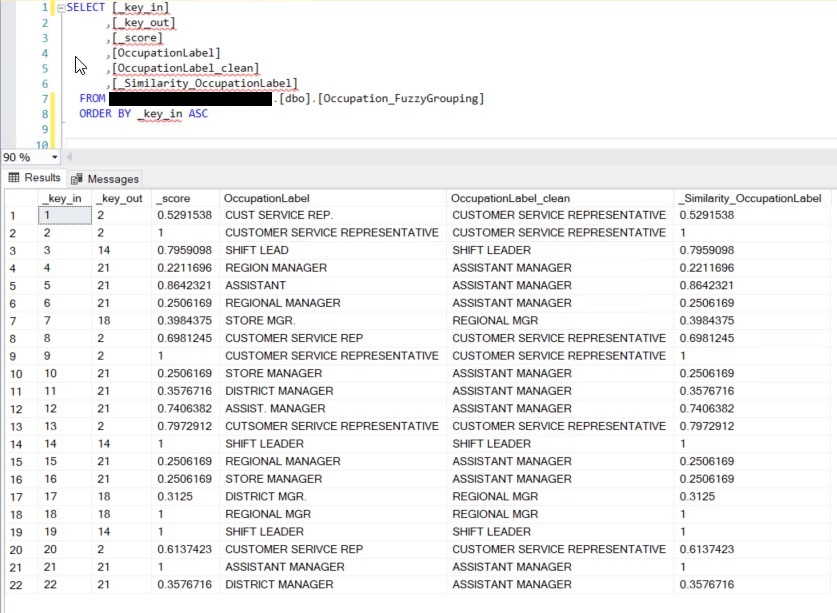
I deleted all rows from the Occupation_FuzzyGrouping table. I changed the Similarity threshold to 0.5:
I executed the package again. This was the new result in the database:
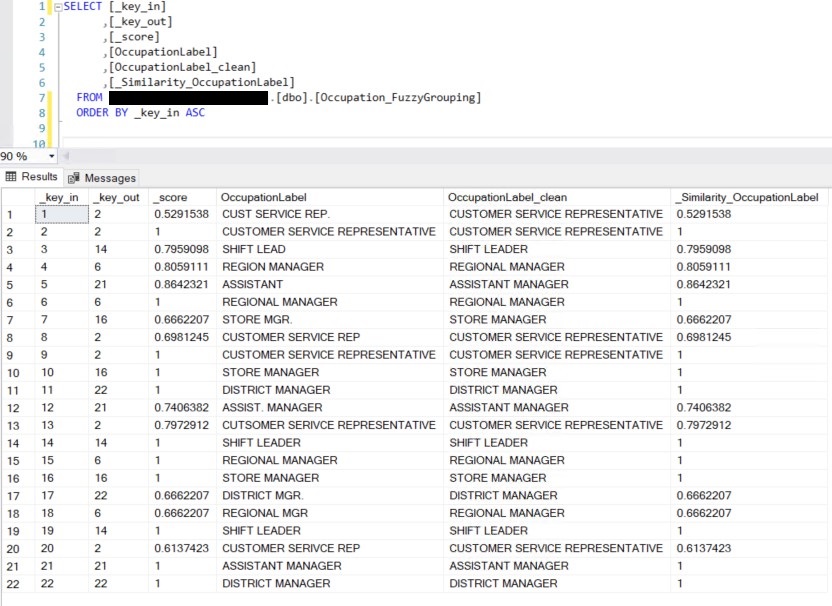
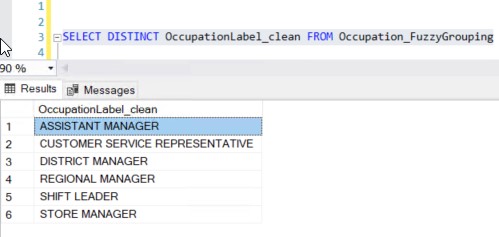
Notice how all values in _Similarity_OccupationLabel are higher than 0.5. That is because 0.5 was used as the Similarity threshold from the Fuzzy Grouping Transformation Editor. Observe how the query SELECT DISTINCT OccupationLabel_clean FROM Occupation_FuzzyGrouping returns the same 6 rows that had previously been obtained from the SSIS package, when writing to the Occupation_FuzzyGrouping table that had only two fields: OccupationID and OccupationLabel. Modifying it and writing to a table with more fields, I did it with the purpose of showing and explaining a little deeper part of what happends behand the scenes to obtain the desired final output:
It almost feels like a spelling correction system, where if the value in the left column is not exactly the same as the value in the right column, we could ask, "Did you mean this?" offering the value in the right column as a suggestion: